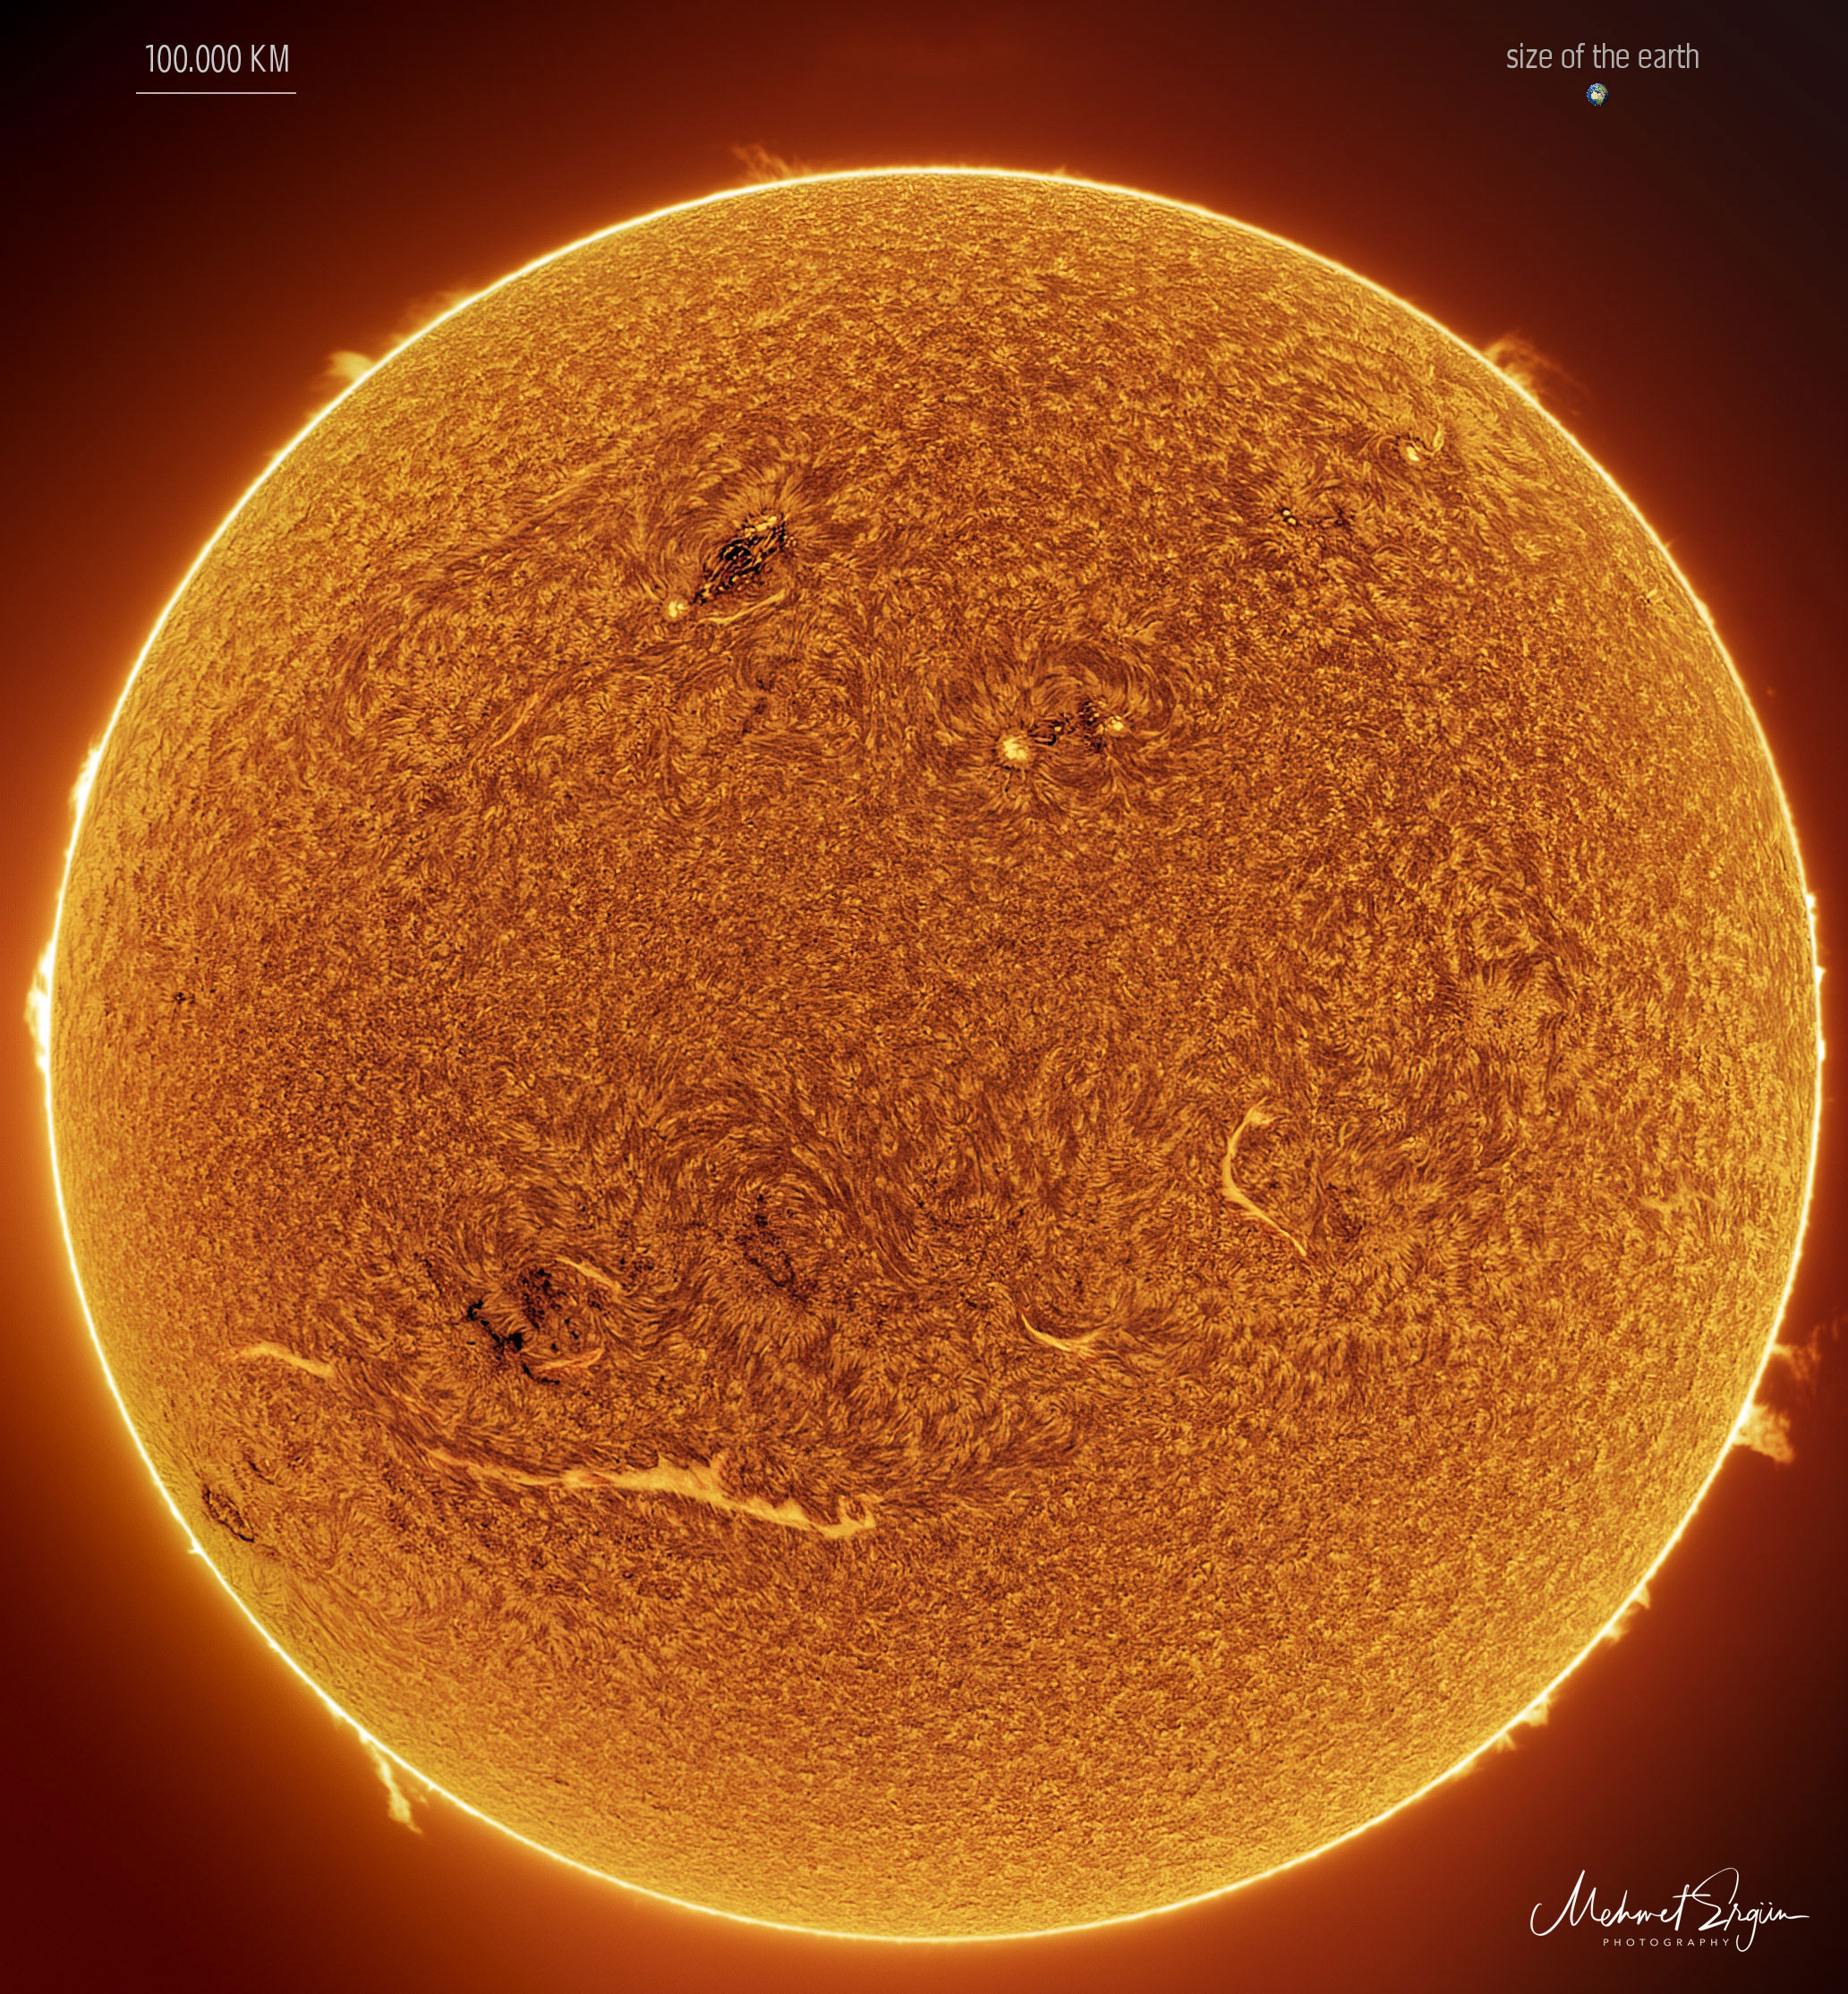
For more detail go to the link and click on the image for a high definition image. You can then move the magnifying glass cursor then click to zoom in and click again to zoom out. When zoomed in you can scan by moving the side bars on the bottom and right side of the image.

During every solar cycle, there’s a maximum and a minimum. Over all, the solar irradiance and magnetic activity has been trending downward for the last few cycles.
As with earth’s seasonal weather, the effects are delayed and it’s only from about the mid-2000s where earth average temps have been falling, down about 1.5 degrees F since then. Expect the quiet solar cycles to continue for at least another 2 1/2 cycles, about 30 years, where the temps will continue to degrade toward Maunder LIA conditions.
More average cold, snow, ice, clouds, rain, volcanic activity & earthquakes. Worse, the colder temps mean lower crop yields and scarcer foodstocks, leading to famines.
To keep up with this and related stuff, here is a user friendly spaceweather.com