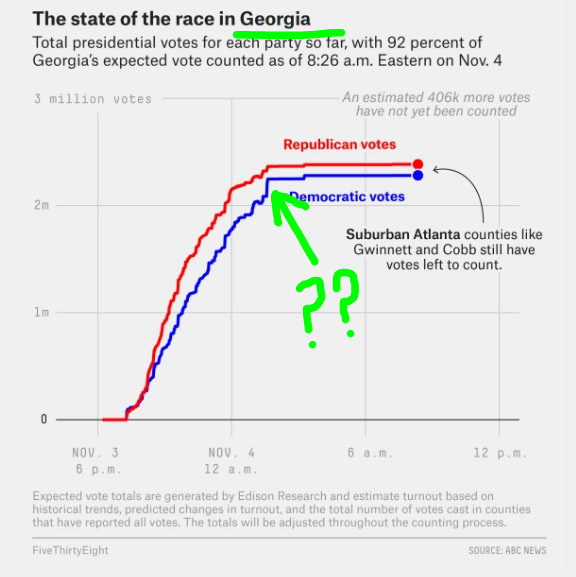
interesting, that graph shows the largest D anomaly at about 1:30 am, while the nyt_ts csv file (purported to be from an edison database) shows the largest D anomaly between about 3:57 am and 8:12 am. these might represent different measuring points (ie different databases) along the vote recording pipeline.
there is probably at least one push type gating function at the middleware database (that is, in the direction of the edison database).
ok, i took a quick glance at the PA segment of the purported edison file but i did not see similar large singularities for Nov. 4 am... hmmm...