To: SeekAndFind; ExTexasRedhead
Thank you for posting all of these graphics.
Everyone...share this info w/your email contacts.
8 posted on
07/28/2020 8:54:32 AM PDT by
Jane Long
(Praise God, from whom ALL blessings flow.)
To: Jane Long
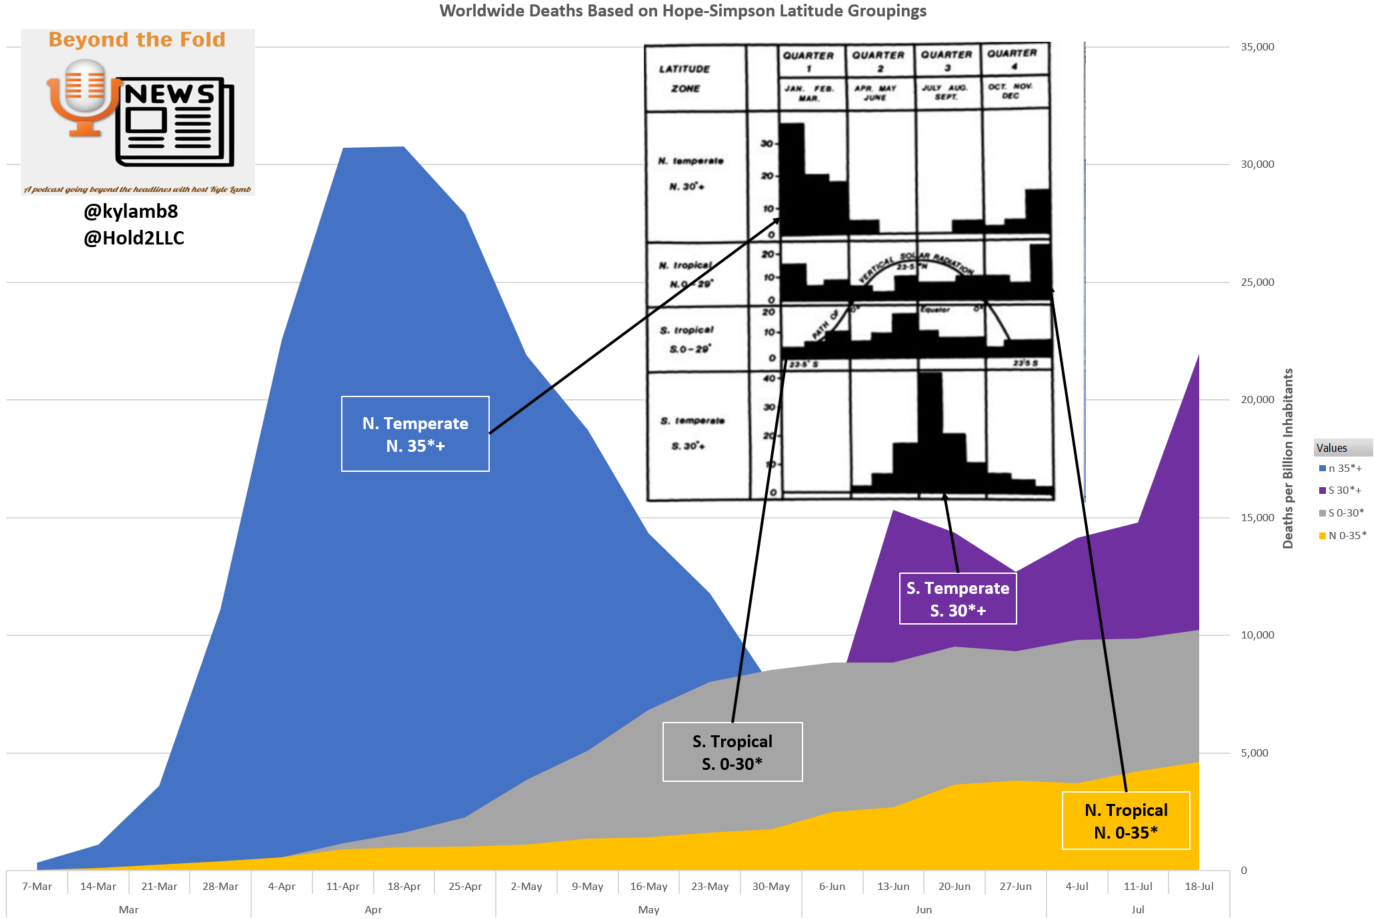
Someone asked how it would look just doing the 50 states and DC. I ran the numbers with California counting as N. Tropical (under 35 N). Check out the correlation to the same flu pattern.

Seasonal pattern of Covid-19 deaths compared to embedded chart of 1964-75 flu outbreak by four seasons. Countries & states split into 35+ N. Lat, 0-35 N, 0-30 S and 30+ S. Flu is the same except 0-30 and 30+ North. This is a striking similarity. Match this with left half of Flu.
To: Jane Long
I don’t need graphics, I knew early on this Covid flu was a political hoax from day one. It will go down as the biggest hoax in history....that said, it has given us guidelines on NOT what to do with the next “ plague”.
12 posted on
07/28/2020 11:56:22 AM PDT by
delta7
FreeRepublic.com is powered by software copyright 2000-2008 John Robinson