<>autopilot<>
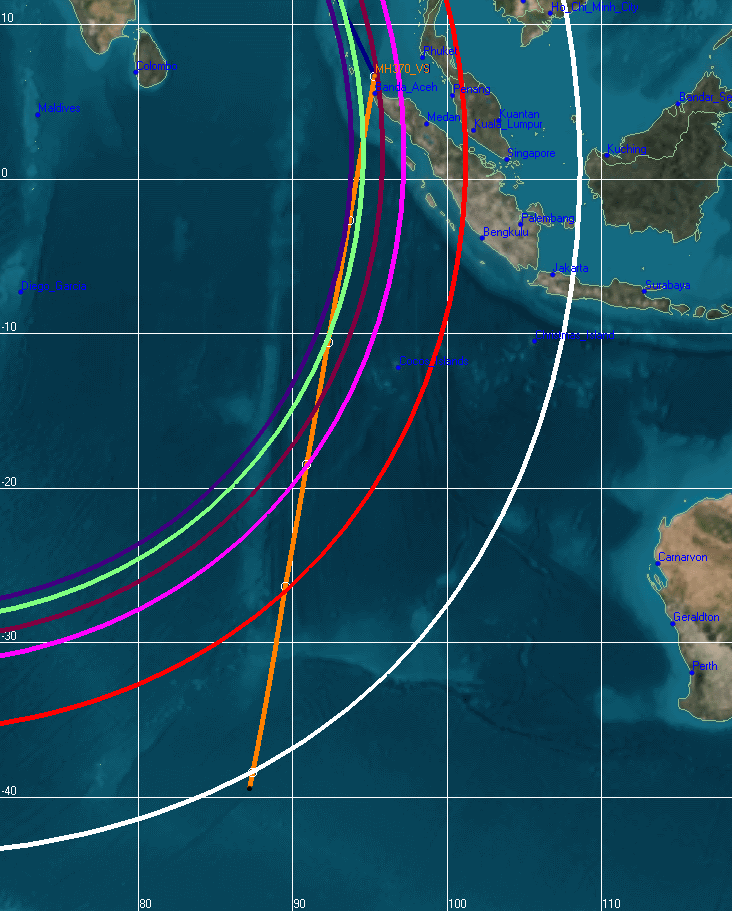
Here are the Inmarsat arcs:
http://www.duncansteel.com/wp-content/uploads/2014/04/V_2D_2.png
The place where it allegedly went on autopilot is ~S4E93 at 4:11 and dropped in the ocean ~S32E97 at 8:11 — that’s 1940 miles over 4 hours.
I would love to see a straight line from point to point through those arcs that allows for a fixed speed hour by hour over those 4 hours.
If I’m reading that chart correctly, the autopilot would have had to fly the first hour at 307 mph and the last hour at 700mph — and that not only bad autopiloting, but it’s also impossible.
If I’m reading that chart correctly, the autopilot would have had to fly the first hour at 307 mph and the last hour at 700mph — and that not only bad autopiloting, but it’s also impossible.
++++++++
Could be but the plot must be a projection from points on a sphere to a flat surface so that would need to be taken into consideration. Plus I don’t understand how whoever made this plot drew the straight line. As you noted, they should have used constant velocity to choose the points and then see if that curve maps to straight line.
Despite the plot, they must have done that to draw the conclusion they did. Don’t you think?
Were the pings received at equal time intervals?