Free Republic
Browse · Search
General/Chat
Topics · Post Article


1 posted on 02/11/2013 9:09:58 AM PST by SeekAndFind
[ Post Reply | Private Reply | View Replies ]


To: SeekAndFind

I’m surprised Sandy Springs, GA did not make the list.


2 posted on 02/11/2013 9:20:22 AM PST by Hoodat ("As for God, His way is perfect" - Psalm 18:30)
[ Post Reply | Private Reply | To 1 | View Replies ]

To: SeekAndFind

Surprised Chicago wasn’t on the worst of the worst list.

L.A., where I live, has deteriorated massively in recent years. Used to have the finest big city police department in the nation. But the liberals have ruined it, just like they ruin every organization they take control of.


3 posted on 02/11/2013 9:20:22 AM PST by Trapped Behind Enemy Lines
[ Post Reply | Private Reply | To 1 | View Replies ]

To: SeekAndFind

sorry, wrong again...

miami is not the worst...it is detriot, and here is why... detroit is headed for an emergency financial manager, it is so broke it cannot pay attention, it has a city clowncil that cannot even agree to turn on the streetlights, more ambulances broken then running, hell, a body lay in a field less than 100’ from a POLICE STATION for almost a week....and a reporter from a local news station even told them about it...criminals surrendering at a fire station because the police would not arrest him ( murder ) and it still took 5 hours for a car to arrive and place him under arrest... keep in mind he TRIED to surrender to police...

detoilet has no money, no credit, poor morale on the police, fire and ambulance forces, and is soooo deep in debt it will not get out of it in my lifetime..

and this does not include a city clowncil that screams “RACISM” everytime someone tries to help them.. just read about the recent belle isle proposal, and you will know all you need to know..

Miami, hell...

WE’RE NUMBER ONE...

Detroit, where the weak are killed and eaten..


5 posted on 02/11/2013 9:26:07 AM PST by joe fonebone (The clueless... they walk among us, and they vote...)
[ Post Reply | Private Reply | To 1 | View Replies ]

To: SeekAndFind

Detroit is number two? C’mon, Motor City, try harder!


6 posted on 02/11/2013 9:27:10 AM PST by Yo-Yo
[ Post Reply | Private Reply | To 1 | View Replies ]

To: SeekAndFind

What is the ethnicity of the mayor of each of these cities?


8 posted on 02/11/2013 9:28:59 AM PST by expat2
[ Post Reply | Private Reply | To 1 | View Replies ]

To: All

The Bottom ten...

All images from city-data.com

Clearly there is a need for busing.....

10 posted on 02/11/2013 9:36:44 AM PST by raybbr (People who still support Obama are either a Marxist or a moron.)
[ Post Reply | Private Reply | To 1 | View Replies ]

To: SeekAndFind

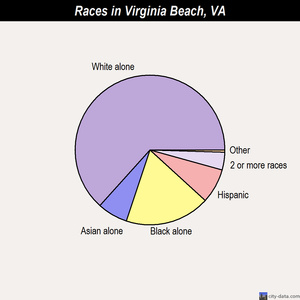
Ha. What a load of crap. If they moved Virginia Beach (VB) to the Eastern Shore of Virginia you know they are about a clueless as a post turtle. VB is in the Tidewater portion of Virginia, not Eastern Shore. It’s called attention to detail and having someone check your facts.


12 posted on 02/11/2013 9:43:01 AM PST by Portcall24
[ Post Reply | Private Reply | To 1 | View Replies ]

To: All

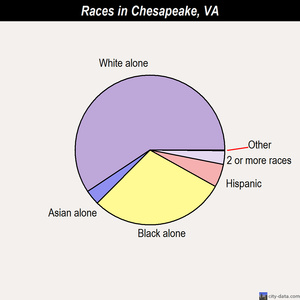
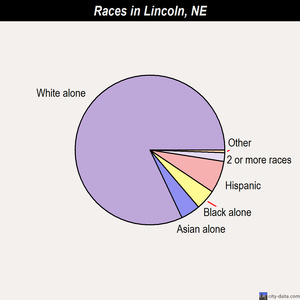
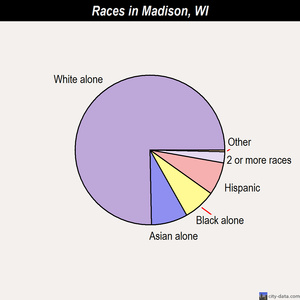
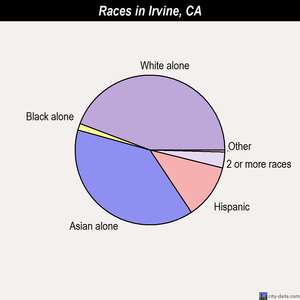
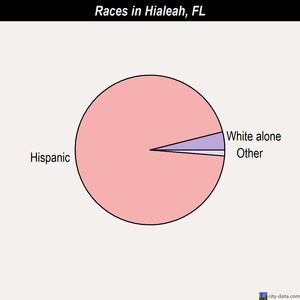
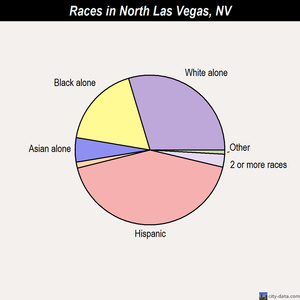
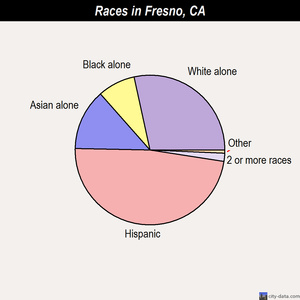
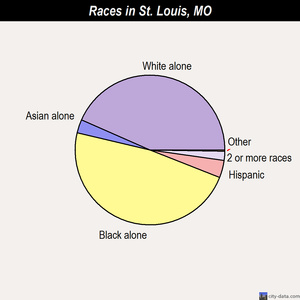
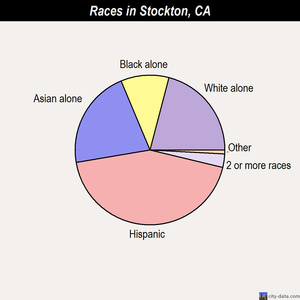
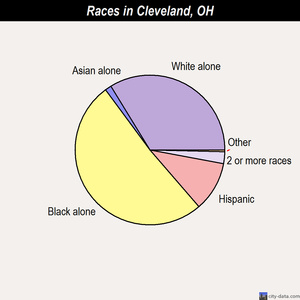
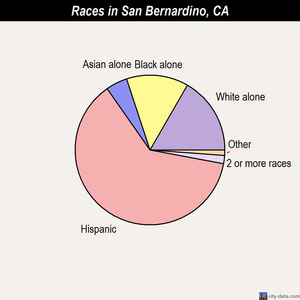
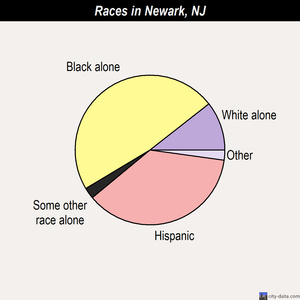
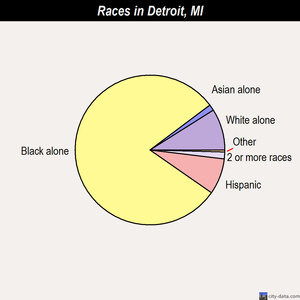
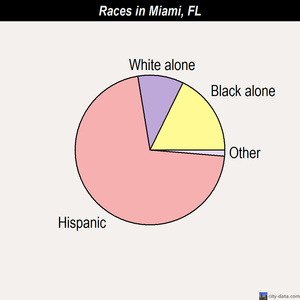
Apparently city-data.com blocks hotlinking images. Click on each link to see racial make up of the twenty cities. They are in order presented in the article.

http://pics.city-data.com/craces2/25290.jpg

http://pics.city-data.com/craces2/1126.jpg

http://pics.city-data.com/craces2/1026.jpg

http://pics.city-data.com/craces2/27463.jpg

http://pics.city-data.com/craces2/26614.jpg

http://pics.city-data.com/craces2/15191.jpg

http://pics.city-data.com/craces2/1955.jpg

http://pics.city-data.com/craces2/28992.jpg

http://pics.city-data.com/craces2/2052.jpg

http://pics.city-data.com/craces2/26525.jpg

The Bottom ten

http://pics.city-data.com/craces2/4556.jpg

http://pics.city-data.com/craces2/15431.jpg

http://pics.city-data.com/craces2/1959.jpg

http://pics.city-data.com/craces2/13635.jpg

http://pics.city-data.com/craces2/2539.jpg

http://pics.city-data.com/craces2/19391.jpg

http://pics.city-data.com/craces2/2441.jpg

http://pics.city-data.com/craces2/16022.jpg

http://pics.city-data.com/craces2/11873.jpg

http://pics.city-data.com/craces2/3857.jpg

Clearly there is a need for busing.....


17 posted on 02/11/2013 9:55:09 AM PST by raybbr (People who still support Obama are either a Marxist or a moron.)
[ Post Reply | Private Reply | To 1 | View Replies ]

To: SeekAndFind
9. Chandler, Ariz.
> Violent crime per 1,000 people: 2.86 (14th lowest)
> Poverty rate: 8.2% (6th lowest)
> Adult population graduated from high school: 91.5% (13th highest)
> Credit rating: Aaa (stable outlook)
> Population: 236,775

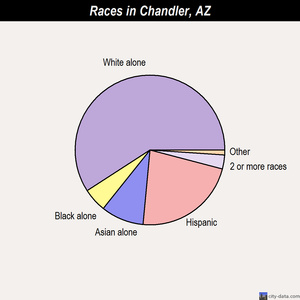
Chandler is one of the newest large cities in the U.S. The city was incorporated in 1951, but the population did not truly expand until very recently. In 1980, Chandler, which is located within the greater Phoenix metropolitan area, had a population of 30,000. Now, it has a population of 247,000. There are countless examples of cities that experienced this level of growth, but few, especially in the Southwest, that maintained a healthy economy through the recession. And despite home values dropping precipitously in the city, like the rest of the Phoenix region, Chandler managed to maintain a healthy economy. In 2010, the city had the ninth-lowest unemployment rate among the largest cities, and the sixth-lowest poverty rate. Chandler has been assigned a perfect Aaa stable rating by Moody’s. The credit rating agency justified the rating: “The stable credit outlook reflects Moody’s expectation that management will continue to maintain favorable financial operations and strong reserve levels despite ongoing economic weakness.”

Chandler (city), Arizona

Want more? Browse data sets for Chandler (city)
    People QuickFacts Chandler Arizona
Population definition and source info Population, 2011 estimate 240,101 6,467,315
Population definition and source info Population, 2010 (April 1) estimates base 236,139 6,392,015
Population, percent change, April 1, 2010 to July 1 definition and source info Population, percent change, April 1, 2010 to July 1, 2011 1.7% 1.2%
Population definition and source info Population, 2010 236,123 6,392,017
Persons under 5 years, percent definition and source info Persons under 5 years, percent, 2010 7.6% 7.1%
Persons under 18 years, percent definition and source info Persons under 18 years, percent, 2010 27.6% 25.5%
Persons 65 years and over, percent definition and source info Persons 65 years and over, percent, 2010 7.8% 13.8%
Female persons, percent definition and source info Female persons, percent, 2010 50.9% 50.3%
 
White persons, percent definition and source info White persons, percent, 2010 (a) 73.3% 73.0%
Black persons, percent definition and source info Black persons, percent, 2010 (a) 4.8% 4.1%
American Indian and Alaska Native persons, percent definition and source info American Indian and Alaska Native persons, percent, 2010 (a) 1.5% 4.6%
Asian persons, percent definition and source info Asian persons, percent, 2010 (a) 8.2% 2.8%
Native Hawaiian and Other Pacific Islander, percent definition and source info Native Hawaiian and Other Pacific Islander, percent, 2010 (a) 0.2% 0.2%
Persons reporting two or more races, percent definition and source info Persons reporting two or more races, percent, 2010 3.7% 3.4%
Persons of Hispanic or Latino origin, percent definition and source info Persons of Hispanic or Latino origin, percent, 2010 (b) 21.9% 29.6%
White persons not Hispanic, percent definition and source info White persons not Hispanic, percent, 2010 61.7% 57.8%
 
Living in same house 1 year & over, percent definition and source info Living in same house 1 year & over, percent, 2007-2011 78.1% 80.1%
Foreign born persons, percent definition and source info Foreign born persons, percent, 2007-2011 13.4% 13.9%
Language other than English spoken at home, percent age 5+ definition and source info Language other than English spoken at home, percent age 5+, 2007-2011 21.9% 27.1%
High school graduate or higher, percent of persons age 25+ definition and source info High school graduate or higher, percent of persons age 25+, 2007-2011 92.3% 85.2%
Bachelor Bachelor's degree or higher, percent of persons age 25+, 2007-2011 39.6% 26.4%
Veterans definition and source info Veterans, 2007-2011 14,893 536,449
Mean travel time to work (minutes), workers age 16+ definition and source info Mean travel time to work (minutes), workers age 16+, 2007-2011 24.5 24.7
 
Housing units definition and source info Housing units, 2010 94,404 2,844,526
Homeownership rate definition and source info Homeownership rate, 2007-2011 66.2% 66.6%
Housing units in multi-unit structures, percent definition and source info Housing units in multi-unit structures, percent, 2007-2011 23.1% 20.6%
Median value of owner-occupied housing units definition and source info Median value of owner-occupied housing units, 2007-2011 $255,100 $197,400
Households definition and source info Households, 2007-2011 86,139 2,344,215
Persons per household definition and source info Persons per household, 2007-2011 2.70 2.64
Per capita money income in the past 12 months (2011 dollars) definition and source info Per capita money income in the past 12 months (2011 dollars), 2007-2011 $32,942 $25,784
Median household income definition and source info Median household income, 2007-2011 $71,343 $50,752
Persons below poverty level, percent definition and source info Persons below poverty level, percent, 2007-2011 7.9% 16.2%
    Business QuickFacts Chandler Arizona
Total number of firms definition and source info Total number of firms, 2007 19,197 491,529
Black-owned firms, percent definition and source info Black-owned firms, percent, 2007 2.5% 2.0%
American Indian- and Alaska Native-owned firms, percent definition and source info American Indian- and Alaska Native-owned firms, percent, 2007 1.3% 1.9%
Asian-owned firms, percent definition and source info Asian-owned firms, percent, 2007 7.7% 3.3%
Native Hawaiian and Other Pacific Islander-owned firms, percent definition and source info Native Hawaiian and Other Pacific Islander-owned firms, percent, 2007 S S
Hispanic-owned firms, percent definition and source info Hispanic-owned firms, percent, 2007 8.1% 10.7%
Women-owned firms, percent definition and source info Women-owned firms, percent, 2007 31.2% 28.1%
 
Manufacturers shipments definition and source info Manufacturers shipments, 2007 ($1000) 3,956,031 57,977,827
Merchant wholesaler sales definition and source info Merchant wholesaler sales, 2007 ($1000) 4,585,919 57,573,459
Retail sales definition and source info Retail sales, 2007 ($1000) 3,608,290 86,758,801
Retail sales per capita definition and source info Retail sales per capita, 2007 $14,787 $13,637
Accommodation and food services sales definition and source info Accommodation and food services sales, 2007 ($1000) 500,934 13,268,514
    Geography QuickFacts Chandler Arizona
Land area in square miles definition and source info Land area in square miles, 2010 64.41 113,594.08
Persons per square mile definition and source info Persons per square mile, 2010 3,665.8 56.3
Persons per square mile definition and source info FIPS Code 12000 04
Counties Maricopa County

21 posted on 02/11/2013 10:23:45 AM PST by Jeff Chandler (WHAT DIFFERENCE DOES IT MAKE?)
[ Post Reply | Private Reply | To 1 | View Replies ]

To: SeekAndFind

Washington D.C.?????


23 posted on 02/11/2013 10:40:51 AM PST by BO Stinkss
[ Post Reply | Private Reply | To 1 | View Replies ]

Free Republic
Browse · Search
General/Chat
Topics · Post Article


FreeRepublic, LLC, PO BOX 9771, FRESNO, CA 93794
FreeRepublic.com is powered by software copyright 2000-2008 John Robinson