**************************************
********************************EXCERPTS******************************
Gladstone is half way up the coast of Queensland, and though GISS (the Goddard Institute of Space Studies) can claim it has not “adjusted” the data, it appears to have cherry picked it.
Thanks to Ken Stewart for his detailed attention. The information here and graphs come from his blog.
Here’s how you double the warming trend without “adjusting” the data.
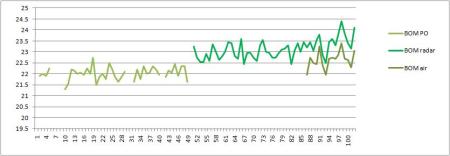
![]() Start with several different records The oldest is the BOM (Bureau of Met) Post Office. The highest is the BOM radar, which stepwise jumps up a whole degree. The last is the BOM Airport, which confirms that the Radar for some reason is 1 degree higher than the rest.
Start with several different records The oldest is the BOM (Bureau of Met) Post Office. The highest is the BOM radar, which stepwise jumps up a whole degree. The last is the BOM Airport, which confirms that the Radar for some reason is 1 degree higher than the rest.
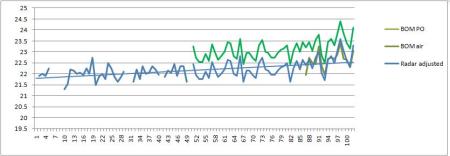
![]() You could drop the BOM Radar figures down to match the other two sets. But, if you wipe out the artificial 1 degree rise in the BOM radar, and if you combined the sets this way, Ken calculates that you only get 0.7 degrees of warming.
You could drop the BOM Radar figures down to match the other two sets. But, if you wipe out the artificial 1 degree rise in the BOM radar, and if you combined the sets this way, Ken calculates that you only get 0.7 degrees of warming.
![]() Instead of this option, you could go the goulash route and carefully selectively delete the awkward parts, ignore the recent lower data set at the airport completely, and splice the left-overs together like this and get a 1.7 degree trend: Tick that box!
Instead of this option, you could go the goulash route and carefully selectively delete the awkward parts, ignore the recent lower data set at the airport completely, and splice the left-overs together like this and get a 1.7 degree trend: Tick that box!

(NB: Assume Gladstone has a local weather cell that’s getting warmer faster than surrounding areas. )
The average trend of the 5 nearest long-record rural sites is 0.8 degrees. Nearby cities of Rockhampton and Bundaberg show adjusted trends of about 0.7 and 0.5 degrees respectively, and Maryborough, ignored by GHCN, shows a trend of 0.4 degrees.
Thus the GISS record for Gladstone is derived from cynically cherry-picked data. The resulting trend of about 1.7 degrees Celsius per Century cannot be justified. The record is false.
If you are James Hansen, it seems you’d choose the goulash. He’s the man responsible for this “trend”.
Does no one have any shame any more? Did they assume that because no one was paid to check their figures that no one would?
A big thank you to Ken, who is doing an excellent job of unpacking the Australian GHCN “trends” on his new blog.
NOTE: The scale on the bottom axis is a little unclear. Ken has noted that the data corresponds with certain years:
“The Post Office from 1909 to 1956 which is dead flat at about 22
degrees; Gladstone Radar from 1958 to 2009, which is immediately 1 degree
warmer, and the Airport from 1994 to 2009, half to 1 degree cooler than
Radar.”"