Posted on 09/08/2009 7:39:53 PM PDT by Signalman
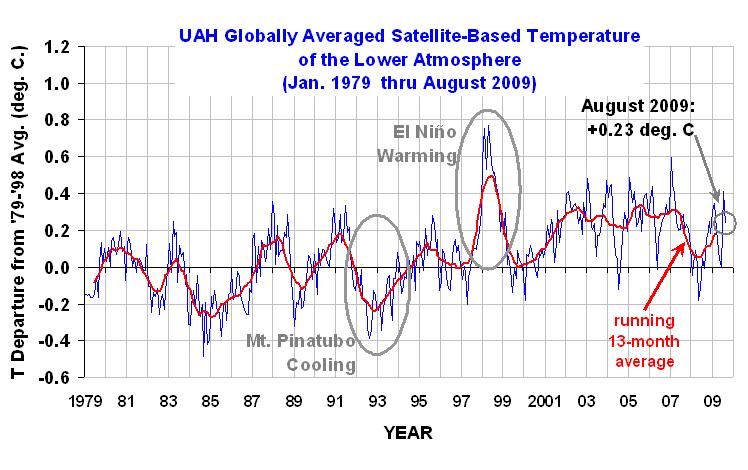
August 2009 saw a modest fall in the global average tropospheric temperature anomaly, from +0.41 deg. C in July to +0.23 deg. C in August. The tropical and Northern Hemispheric troposphere remain quite warm, but the Southern Hemisphere cooled by over 0.4 deg. C in the last month.
The Global Tropospheric anomaly (1979 to Present) for that month was .231 degrees Celsius or about 1/5 of a degree.(The troposphere is the lowest portion of Earth's atmosphere. It contains approximately 75 percent of the atmosphere's mass and 99 percent of its water vapor and other gases)
And the last update of the 13 month average reading showed +.2 C or 1/5 of a degree.
So, IOW, for the past 20 years, while we evil humans were discharging C02 into the atmosphere, the average global temperature has risen a "whopping" 1/5 of a degree! And for that, the Democrats want to pass a "Cap and Trade" Bill that will destroy our economy. Go figure.
Actually, make that the past 30 years.
How did this August compare to other Augusts?
Assuming a rational populace, if it doesn’t dip below baseline in the next 4 years, the global warming crowd are going to be winning arguments and getting more attention. If it does dip below baseline, then the global warming folks will be all washed up.
This is how I read the graph and future politics anyway.
And 10 years ago they were predicting the earth's temperature would raise anywhere from 4-11 degrees over the next 100 years. Since those outlandish predictions then temps have fallen.
I tend to agree with you on the ability of short term thinkers, but looking at that chart, how was the zero line established, and where is the thermometer that establishes 'global temperature'?
Hummmm? Bring those points up to the average Joe, and just maybe, they will start thinking.
I know that sure as hell, even the illiterate in the Northeast US will tell you we had a very cool summer this year and you would lose creditability very fast if you tried to tell them different.
I’d like to see the data and systems they used to create this chart. Wanna bet they played funny with the numbers?
hey...no fair. you can do math !
And the last update of the 13 month average reading showed +.2 C or 1/5 of a degree.
Interesting time reference in the chart....
The vertical axis shows 1979 to 1998 as the average period - which nicely misses most of the big El Nino spike upwards at the end of that period. If you add a few more years to the period the average is measured over, I bet you could cut the August number down...:^)
Disclaimer: Opinions posted on Free Republic are those of the individual posters and do not necessarily represent the opinion of Free Republic or its management. All materials posted herein are protected by copyright law and the exemption for fair use of copyrighted works.
