Free Republic
Browse · Search
Bloggers & Personal
Topics · Post Article

Skip to comments.

HUGE: The Coronavirus Tracking Project’s Numbers are Suspect After They Are Caught Tacking On Previous Deaths to Current Totals
Gateway Pundit ^ | 07/12/2020 | Joe Hoft

Posted on 07/12/2020 10:24:50 AM PDT by SeekAndFind

Twitter user Kyle Lamb put together a chart showing the number of deaths reported by the Coronavirus Tracking Project linked to the China coronavirus.

The results of his work show that the CTP is adding deaths each week from prior periods that make the current period death totals appear greater than they really are and some of these additions are very suspect.

The number of deaths reported publicly come from the Covid Tracking Project.

Kyle Lamb created a chart using data from the CDC that shows the number of COVID-19 deaths reported by the CDC and the weeks the death occurred. In the chart below he shows the total number of deaths from COVID-19 reported by the CDC in the top row in grey. These totals change as each week passes with new deaths being reported per week as is expected.

In a typical mortality table you should see a few deaths being reported in week one and many more in the following few weeks but then the number of deaths reported that occurred during a specific week decrease as time goes by. After a few weeks this lag in reporting diminishes and eventually all deaths are reported. This is typical in the insurance industry where the industry accounts for deaths being reported on a consistent rate over time with very few claims reported after a few months from the date of event (i.e. the date someone died). This may seem morbid to those not in the insurance industry but this is how it is done. Rarely are there jumps in reporting in prior periods unless something odd is going on (e.g. fraud).

What Kyle Lamb shows in his analysis is that the CDC is reporting deaths on a weekly basis. Many of the deaths are reported in the first few weeks after the death occurred (see cells in red, orange and yellow).


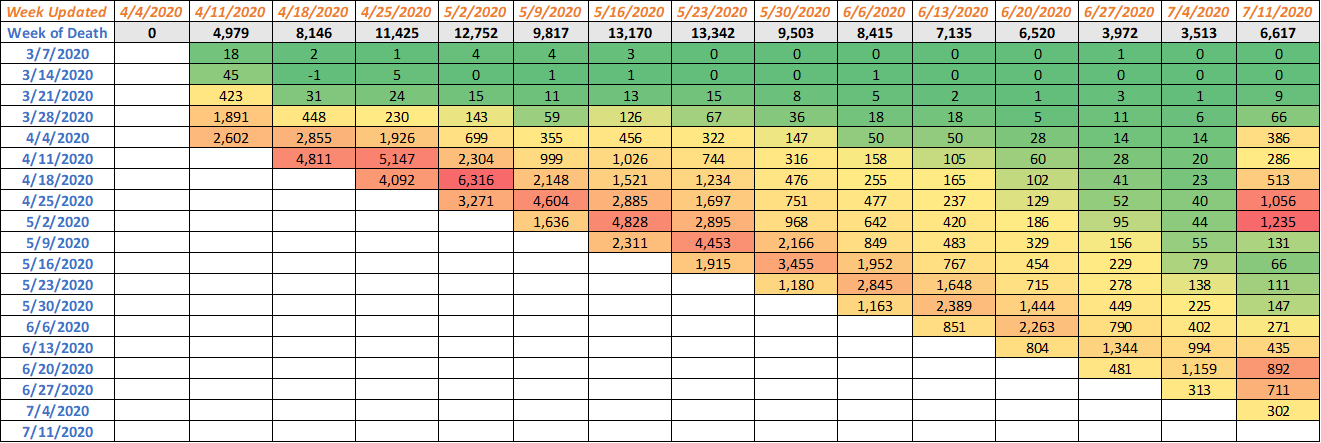
Top row: Deaths reported publicly by week
West to East: Provisional death counts by CDC when death occurred, columns representing the week when CDC added them.

Color striping indicates a way to track trends based reporting week. First red = 1st week of data, Orange = 2nd, etc.

Most recent four week sum of deaths by reporting week:

July 11: 2,340
July 4: 2,868
June 27: 3,064
June 20: 5,226
June 13: 5,665
June 6: 6,809
May 30: 7,769
May 23: 10,960
May 16: 11,545
May 9: 9,387
May 2: 12,590

— Kyle Lamb (@kylamb8) July 11, 2020

Lamb reports what he is seeing:

By analyzing this data, we can see if states were changing prior deaths to "probable" or if they're backlogging. When we do this, we can combat the increasing deaths narrative. What we found this week is that the couple of spikes that were seen in 'public' numbers were not spikes

— Kyle Lamb (@kylamb8) July 11, 2020


This is what's happening:

1) States report new deaths. Regardless of when they happened. If they increase, media blows it up.
2) These deaths are reported to the CDC and lag a bit
3) When CDC updates numbers, we can see when those deaths were occurring the states had reported

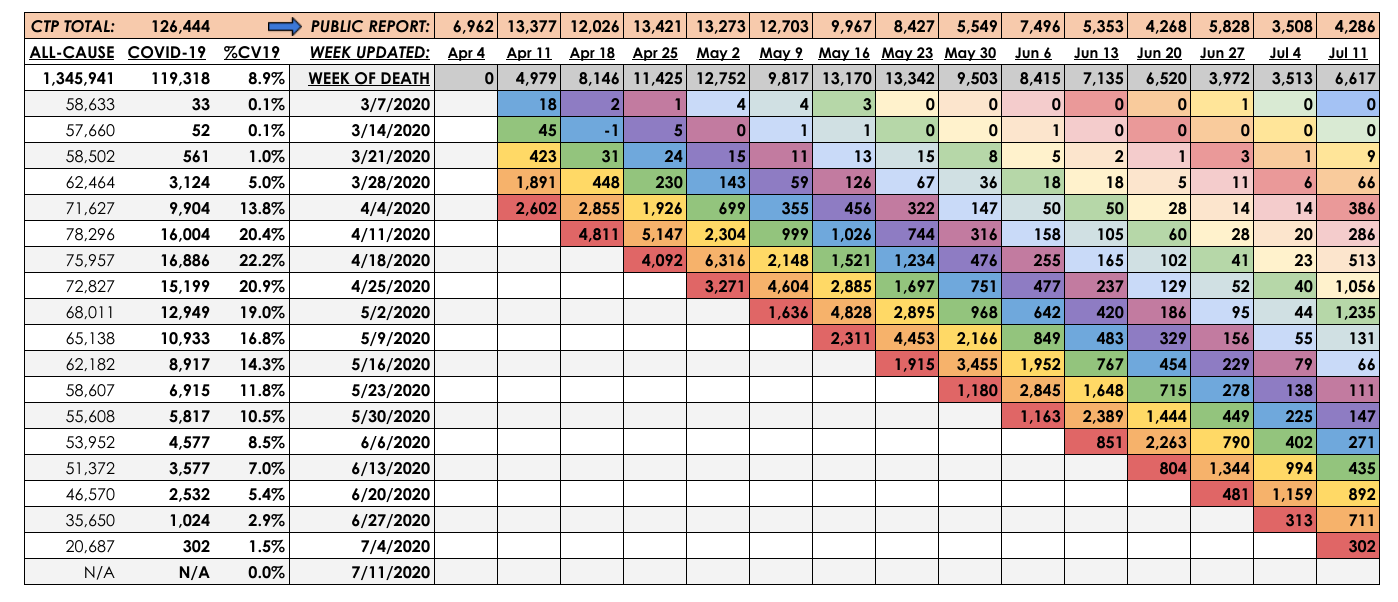
Another individual took the data from the CDC used by Kyle Lamb and created a chart showing anomalies in CDC reporting. During this past week, the number of deaths reported included deaths from April which were suddenly reported this week.

Kyle nice work. Same data, but with a "heat map" showing the peaks with respect to each column. pic.twitter.com/0ruiO7qgO3

— Justin Houston (@houstonniner) July 11, 2020


Same data, but with a "heat map" showing the peaks with respect to each column.

Another individual put together a chart based on the CDC data that shows that deaths have been decreasing since April – no matter what the MSM says:

Alistair, given what we now see in the CDC's Deaths by Date of Death data, which is broken out only by week, you can make the case that the date of peak deaths (assuming a smoothed curve) falls somewhere around the end of the WE Apr 11 or beginning of WE Apr 18. pic.twitter.com/34IsMIHSen

— Todd Lowdon (@tlowdon) July 11, 2020

Data reported by the CDC indicates that the China coronavirus reached its peak in mortality in April. The number deaths reported this past week included thousands of deaths from April. The CDC doesn’t share that the deaths reported in a given week include deaths from months ago.


TOPICS: Health/Medicine; Science; Society
KEYWORDS: cdc; coronavirus; deathrate; deaths; fraud; plandemic; tracking; trackingproject
Navigation: use the links below to view more comments.
first 1-2021-27 next last

1 posted on 07/12/2020 10:24:50 AM PDT by SeekAndFind
[ Post Reply | Private Reply | View Replies]

To: SeekAndFind

The deep state continues it attack on our Republic.


2 posted on 07/12/2020 10:26:52 AM PDT by antidemoncrat (uff)
[ Post Reply | Private Reply | To 1 | View Replies]

To: SeekAndFind
 
 
Slowly closing in on the pencil-whipping that's going on. It's apparent that official sources aren't going to audit themselves so it's left up to others to run the numbers and expose the fraud.


3 posted on 07/12/2020 10:30:51 AM PDT by lapsus calami (What's that stink? Code Pink ! ! And their buddy Murtha, too!)
[ Post Reply | Private Reply | To 1 | View Replies]

To: SeekAndFind

Figures never Lie, But Liars Figure.

It was “clear” from the beginning, watching Dr. Birx give an explanation of the method of classification, it was pure BS.


4 posted on 07/12/2020 10:35:28 AM PDT by Texas Fossil ((Texas is not where you were born, but a Free State of Heart, Mind & Attitude!))
[ Post Reply | Private Reply | To 1 | View Replies]

To: SeekAndFind

So, to get it straight.... the new deaths are those deaths in April that were asymptomatic deaths but now were tested and shown to be covid?


5 posted on 07/12/2020 10:37:18 AM PDT by teeman8r (Armageddon won't be pretty, but it's not like it's the end of the world)
[ Post Reply | Private Reply | To 1 | View Replies]

To: Texas Fossil

We’re swamped with lies and the dupes that believe em.


6 posted on 07/12/2020 10:37:38 AM PDT by Theophilus (Mask America Great Again)
[ Post Reply | Private Reply | To 4 | View Replies]

To: SeekAndFind

They are doing like NYC, they are reclassifying the cause of death. Chasing the Fed Dollars.

Going back and time and making revisions.


7 posted on 07/12/2020 10:38:34 AM PDT by Texas Fossil ((Texas is not where you were born, but a Free State of Heart, Mind & Attitude!))
[ Post Reply | Private Reply | To 1 | View Replies]

To: antidemoncrat
waterboard the government

69619-128649233973576-2117014686-n

8 posted on 07/12/2020 10:39:13 AM PDT by timestax
[ Post Reply | Private Reply | To 2 | View Replies]

To: Theophilus

And the Insane are Running the Asylum.

Pure Political Theater.


9 posted on 07/12/2020 10:40:05 AM PDT by Texas Fossil ((Texas is not where you were born, but a Free State of Heart, Mind & Attitude!))
[ Post Reply | Private Reply | To 6 | View Replies]

To: Texas Fossil
It was “clear” from the beginning, watching Dr. Birx give an explanation of the method of classification, it was pure BS.

I cringed at how she was contorting her explanations. She was definitely using a tactic where the explanation was long and drawn out so the average person just zoned out and did she it on purpose.


10 posted on 07/12/2020 10:50:08 AM PDT by ssfromla
[ Post Reply | Private Reply | To 4 | View Replies]

To: ssfromla

Yes. Weasel words.


11 posted on 07/12/2020 10:55:09 AM PDT by Texas Fossil ((Texas is not where you were born, but a Free State of Heart, Mind & Attitude!))
[ Post Reply | Private Reply | To 10 | View Replies]

To: SeekAndFind

What would be interesting would be to compare all FLU (not Covid) deaths in Q2 of 2020 with all previous year FLU deaths in Q2...


12 posted on 07/12/2020 11:26:33 AM PDT by rhinohunter (FAUCI MUST GO!!!)
[ Post Reply | Private Reply | To 1 | View Replies]

To: SeekAndFind

I’m confused. Are they double counting/padding or are the “spikes” from lag. The article seems to say both.


13 posted on 07/12/2020 11:39:16 AM PDT by moehoward
[ Post Reply | Private Reply | To 1 | View Replies]

To: SeekAndFind

They couldn’t track muddy dog prints across their kitchen table


14 posted on 07/12/2020 11:43:04 AM PDT by butlerweave
[ Post Reply | Private Reply | To 1 | View Replies]

To: SeekAndFind

Texas doesn’t report a death is CV unless the person tested positive. If you die at home before you get to the hospital, then you’re not counted on the charts. IOW, Texas is most likely under counting.


15 posted on 07/12/2020 12:04:45 PM PDT by bgill
[ Post Reply | Private Reply | To 1 | View Replies]

To: moehoward

The most absurd data for the week of July 11 comes from the backlogs of weeks May 16 and 23 which are colored green and beige respectively. That is from a backlog of almost 2 months ago yet they show 1235 brought over from May 16 and and 1056 for the week of May 23. What makes it especially absurd is when you contrast it with the data for the previous week ending July 4 in which May 16 backlog shows only 40 and May 23 is only 23. No way you can have such a YUUUUGE backlog jump in just a week.


16 posted on 07/12/2020 12:06:31 PM PDT by PJ-Comix (Trump 2020 Victory Cruise Is Definitely ON!!! Embarking Dec. 6 from Port Everglades)
[ Post Reply | Private Reply | To 13 | View Replies]

To: SeekAndFind
Nice work on a chart (I like colors) and see ‘How Could the CDC Make That Mistake?’ The government’s disease-fighting agency is conflating viral and antibody tests, compromising a few crucial metrics that governors depend on to reopen their economies. Pennsylvania, Georgia, Texas, and other states are doing the same. Alexis C. Madrigal Robinson Meyer May 21, 2020
17 posted on 07/12/2020 12:10:28 PM PDT by daniel1212 (Trust the risen Lord Jesus to save you as a damned and destitute sinner + be baptized + follow Him)
[ Post Reply | Private Reply | To 1 | View Replies]

To: SeekAndFind

May or may not be related, but definitely noteworthy:

Bogus deaths spikes:
7,260, New York state, July 9th
956, New Jersey, July 2nd
957, New Jersey, July 3rd

Some other states have shown spikes that were dubious, but none I think comparable to the above.


18 posted on 07/12/2020 12:33:53 PM PDT by ChessExpert (NAFTA - Not A Free Trade Agreement)
[ Post Reply | Private Reply | To 1 | View Replies]

To: daniel1212


19 posted on 07/12/2020 12:34:08 PM PDT by lapsus calami (What's that stink? Code Pink ! ! And their buddy Murtha, too!)
[ Post Reply | Private Reply | To 17 | View Replies]

To: SeekAndFind

Geee Ya Figure?
Funny without graphs I saw this Months ago


20 posted on 07/12/2020 3:03:21 PM PDT by TexasTransplant ( I am going back to work... permission or not)
[ Post Reply | Private Reply | To 1 | View Replies]


Navigation: use the links below to view more comments.
first 1-2021-27 next last

Disclaimer: Opinions posted on Free Republic are those of the individual posters and do not necessarily represent the opinion of Free Republic or its management. All materials posted herein are protected by copyright law and the exemption for fair use of copyrighted works.

Free Republic
Browse · Search
Bloggers & Personal
Topics · Post Article

FreeRepublic, LLC, PO BOX 9771, FRESNO, CA 93794
FreeRepublic.com is powered by software copyright 2000-2008 John Robinson