Free Republic
Browse · Search
Bloggers & Personal
Topics · Post Article

Skip to comments.

Obama Hits New TA Low -10 Day Moving Average (47.5% approval, 52% disapproval)
OpiniPundit ^ | SEPTEMBER 07, 2009 | OpiniPundit

Posted on 09/07/2009 9:49:16 AM PDT by RobinMasters


(Excerpt) Read more at exposingtheleft.blogspot.com ...


TOPICS: Government; Politics; Society
KEYWORDS: 2009polls; bho44; bhojobapproval

1 posted on 09/07/2009 9:49:16 AM PDT by RobinMasters
[ Post Reply | Private Reply | View Replies]

To: RobinMasters

BTTT!!

Let’s break him! This can be his Waterloo!


2 posted on 09/07/2009 9:51:06 AM PDT by ConservativeMan55
[ Post Reply | Private Reply | To 1 | View Replies]

To: RobinMasters

Hurry up No ‘Bama! You are losing your political capital...


3 posted on 09/07/2009 9:54:46 AM PDT by John123 (If Teddy was the lion of the senate... then we were the prey.)
[ Post Reply | Private Reply | To 1 | View Replies]

To: ConservativeMan55

Unfortunately for the GOP, 0bama’s disapproval is not translating into approval for the Republican party. Americans still don’t feel like Republicans get it. Voters continue to feel like the Republicans have lost their way and are rudderless, and that won’t change until the Republicans shake up their party leadership.
That needs to start in the House, by replacing the ineffectual Boehner with the more charismatic Mike Pence. To be a leader, you need people to want to follow you, and John Boehner doesn’t have that. Mike Pence does.

Real Republican leadership is the missing element to the Republicans’ elusive recovery. If they continue to ignore this into the midterms, their opportunity to regain power will slip away.


4 posted on 09/07/2009 9:56:51 AM PDT by counterpunch (In this present crisis, government is not the solution to our problem. Government is the problem.)
[ Post Reply | Private Reply | To 2 | View Replies]

To: RobinMasters

It’s a blog. Who is the pollster?


5 posted on 09/07/2009 9:56:59 AM PDT by BunnySlippers (I LOVE BULL MARKETS . . .)
[ Post Reply | Private Reply | To 1 | View Replies]

To: BunnySlippers

http://www.freerepublic.com/focus/bloggers/2334003/posts?page=3


6 posted on 09/07/2009 9:59:06 AM PDT by RobinMasters
[ Post Reply | Private Reply | To 5 | View Replies]

To: ConservativeMan55

Oh by the end of the week, after the mega media blitz on his speeches, then they will claim he’s back up in the polls...


7 posted on 09/07/2009 10:02:51 AM PDT by Freddd (Government run health care=paying more and being denied what we already have.)
[ Post Reply | Private Reply | To 2 | View Replies]

To: BunnySlippers
It’s a blog. Who is the pollster?

I've been looking also.

8 posted on 09/07/2009 10:03:47 AM PDT by immadashell
[ Post Reply | Private Reply | To 5 | View Replies]

To: counterpunch

“Unfortunately for the GOP, 0bama’s disapproval is not translating into approval for the Republican party.”

Your statement is not quite true:

http://www.freerepublic.com/focus/f-news/2330293/posts


9 posted on 09/07/2009 10:17:39 AM PDT by DarthVader (Liberalism is the politics of EVIL whose time of judgment has come.)
[ Post Reply | Private Reply | To 4 | View Replies]

To: BunnySlippers

Based on Rasmussen data.


10 posted on 09/07/2009 10:28:19 AM PDT by traderrob6
[ Post Reply | Private Reply | To 5 | View Replies]

To: RobinMasters

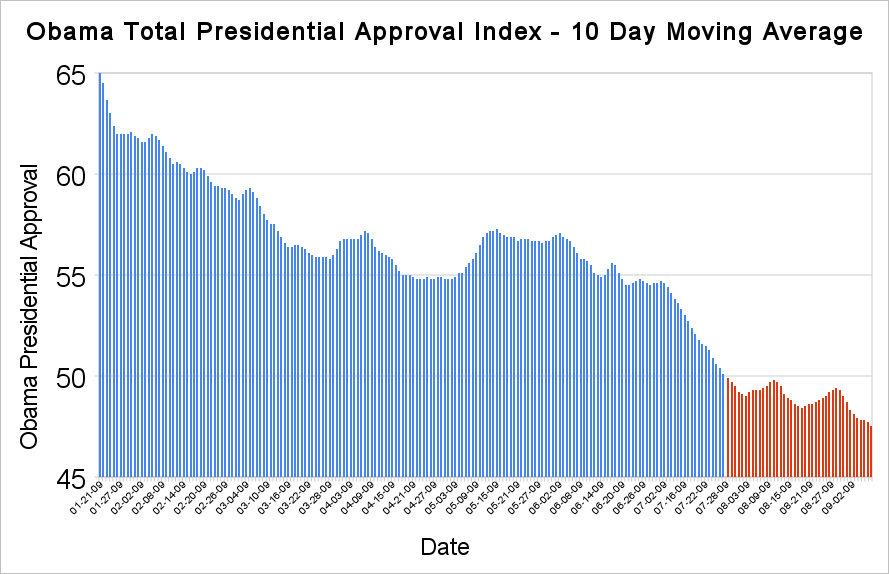
Amazing. My chart first posted to FR this morning. I’m famous.


11 posted on 09/07/2009 10:37:12 AM PDT by InterceptPoint
[ Post Reply | Private Reply | To 1 | View Replies]

To: InterceptPoint

>> My chart first posted to FR this morning <<

Would be interested to learn something about your methodoloty.


12 posted on 09/07/2009 11:04:52 AM PDT by Hawthorn
[ Post Reply | Private Reply | To 11 | View Replies]

To: Hawthorn
Would be interested to learn something about your methodoloty.

I use Google Docs spreadsheet and a scheme developed by markomalley from Free Republic to plot the below 50% values in red and the above 50% values in blue using two series.

The methodology is simple. You pull the Rasmussen data in from his website and then average the most recent 10 days of the Total Presidential Approval poll and plot it as as the current value. This smooths out the bumps and you get to see the trends a little more clearly. It's like using a low pass filter on the data.

13 posted on 09/07/2009 1:26:34 PM PDT by InterceptPoint
[ Post Reply | Private Reply | To 12 | View Replies]

To: InterceptPoint
>> You pull the Rasmussen data in from his website and then average the most recent 10 days <<

Good work! And have you done the same with Rasmussen's "index" of strongly approve minus strongly disapprove? It jumps around so much that some sort of moving average might give us a better picture of the real trend than we now have.

(I know of course that Ras already uses a 3-day m.a. to compute his index. But it still is too volatile for my taste.)

14 posted on 09/08/2009 5:25:29 AM PDT by Hawthorn
[ Post Reply | Private Reply | To 13 | View Replies]

To: Hawthorn
Posted a couple of days ago on FR:

Obama Presidential Approval Index - 10 day moving average

15 posted on 09/08/2009 5:31:10 AM PDT by InterceptPoint
[ Post Reply | Private Reply | To 14 | View Replies]

To: InterceptPoint

>> Posted a couple of days ago on FR <<

Excellent! Rasmussen should hire you to do graphics for his organization!


16 posted on 09/08/2009 5:58:09 AM PDT by Hawthorn
[ Post Reply | Private Reply | To 15 | View Replies]

Disclaimer: Opinions posted on Free Republic are those of the individual posters and do not necessarily represent the opinion of Free Republic or its management. All materials posted herein are protected by copyright law and the exemption for fair use of copyrighted works.

Free Republic
Browse · Search
Bloggers & Personal
Topics · Post Article

FreeRepublic, LLC, PO BOX 9771, FRESNO, CA 93794
FreeRepublic.com is powered by software copyright 2000-2008 John Robinson