Free Republic
Browse · Search
General/Chat
Topics · Post Article

To: Red Badger

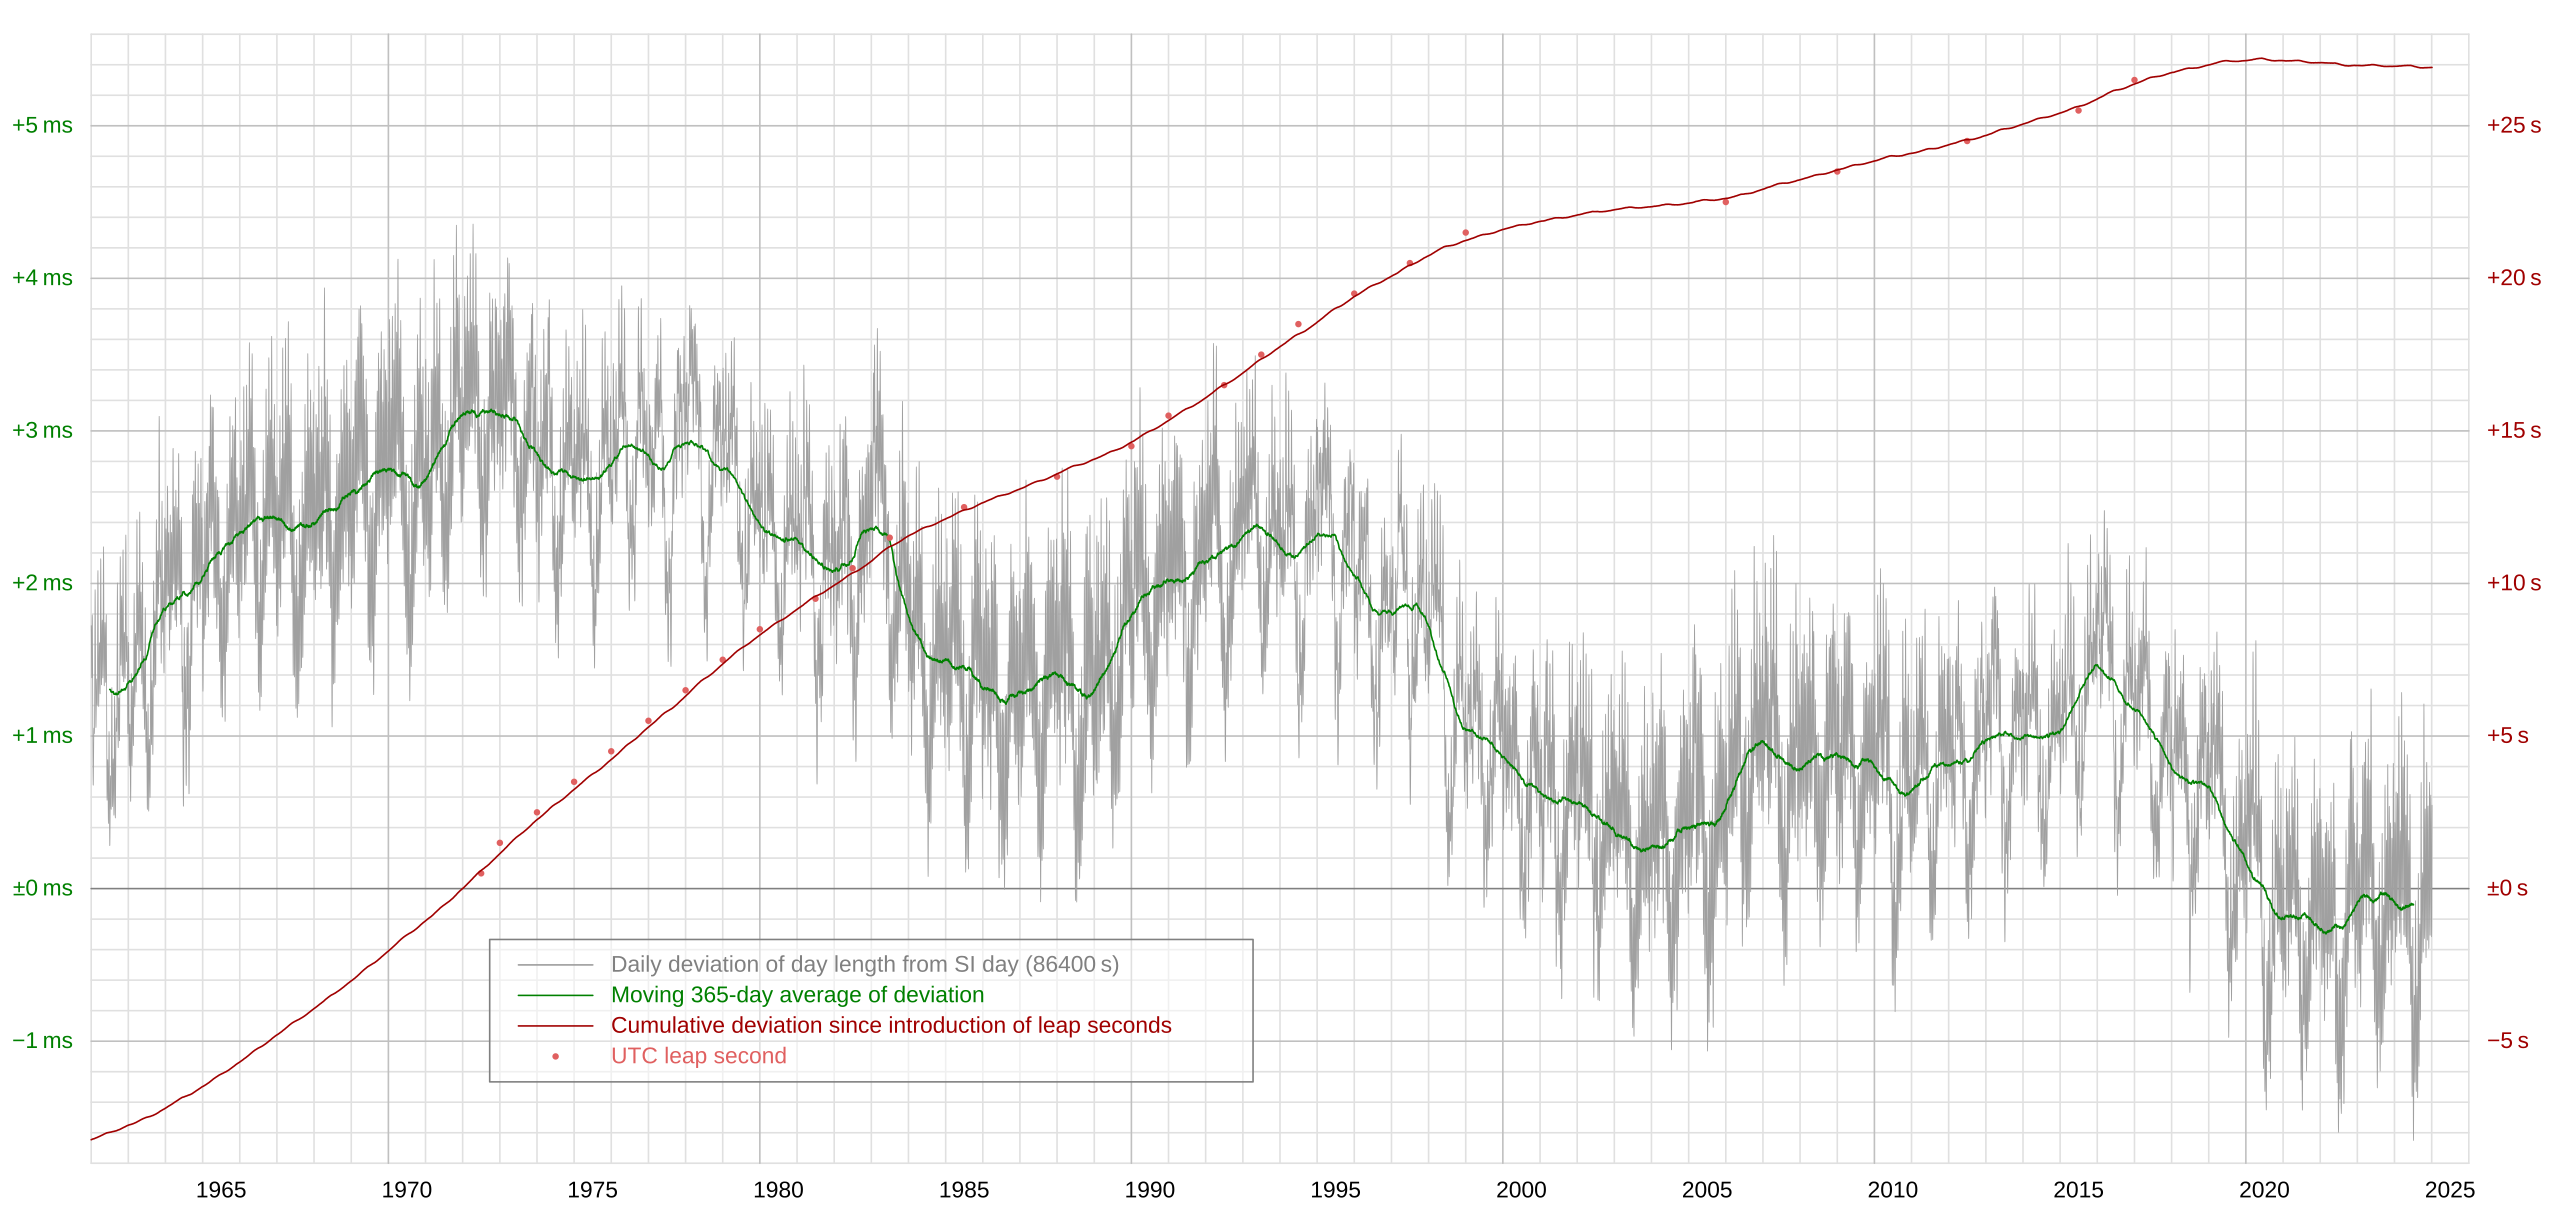
This is the variation in the length of day, since 1962, and the adoption of Atomic Time. (UTC was adopted in 1972.) The green line is a 365 day running average of the excess length of day, the daily variation indicated by the gray line. The red line is the cumulative excess since January 1, 1972. The vertical scales are different, and the green line, in milliseconds per day is the slope of the red line in total seconds, the integral of the green line since January 1, 1972. The vertical scale of the green line is on the left, in green, and the red line in red on the right. The gray and green lines have identical scales. I maintain that 60 nanseconds per day, on the gray line a displacement of 3 three ten-thousandths of the minor tick marks, is NOT measureable, but admittedly is calculable.

26 posted on 08/11/2026 6:55:33 AM PDT by Lonesome in Massachussets ( Thorough planning and careful preparation is no substitute for wishful thinking. )
[ Post Reply | Private Reply | To 1 | View Replies ]


To: Lonesome in Massachussets

A slow down of 60 nanoseconds per day would mean that in a little more than 45,000 years the red line would be one minor tick (one second) higher than it would otherwise be. It has risen by 34 seconds since 1962. This means that that one damned dam will add a whopping 1.0 second to the 1,325,300 seconds of natural accumulated slow down! 15 sunsets forgone, lost forever! One every 3,000 years! Fifteen days of human history whipped from the calendar! Oh, Pope Gregory, where art thou!


32 posted on 08/11/2026 7:12:04 AM PDT by Lonesome in Massachussets ( Thorough planning and careful preparation is no substitute for wishful thinking. )
[ Post Reply | Private Reply | To 26 | View Replies ]

Free Republic
Browse · Search
General/Chat
Topics · Post Article


FreeRepublic, LLC, PO BOX 9771, FRESNO, CA 93794
FreeRepublic.com is powered by software copyright 2000-2008 John Robinson