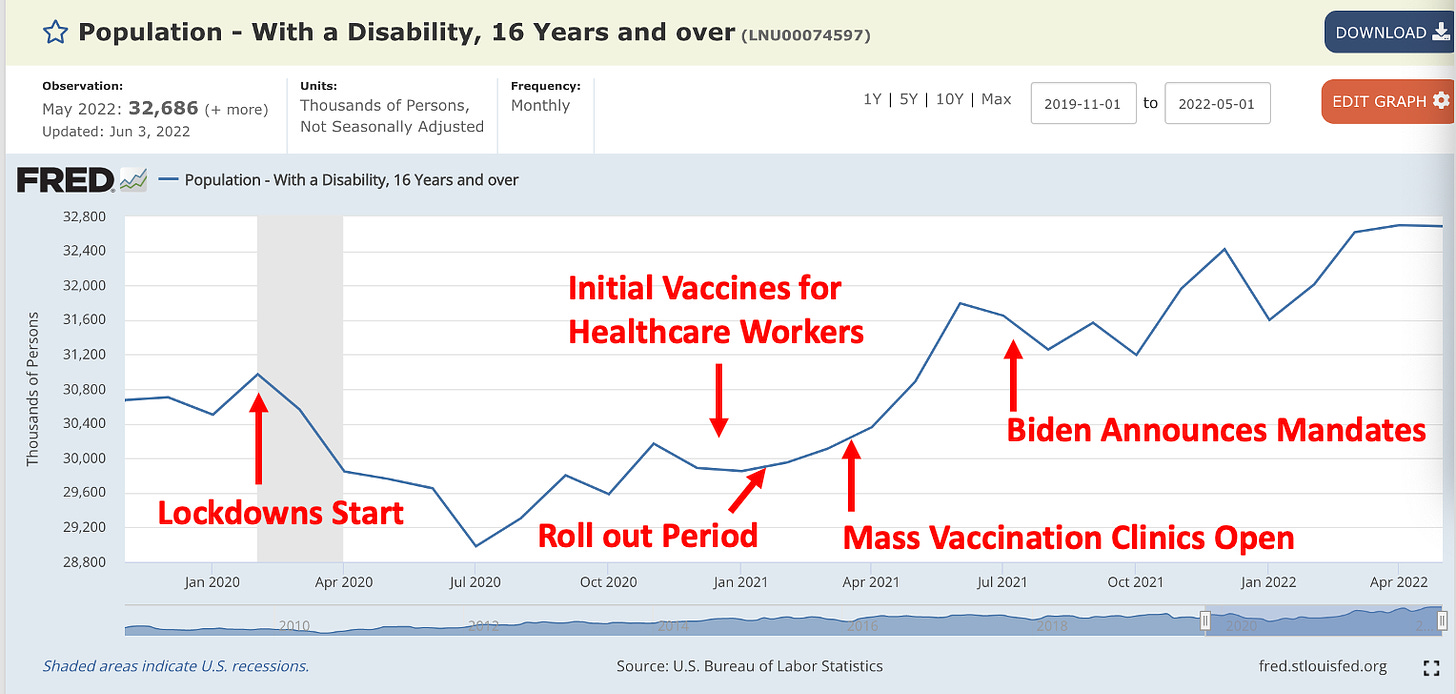
https://fred.stlouisfed.org/series/LNU00074597
I had to go to the source to make sure you weren’t doing some selective editing where you started the graph. Nope, it was at about the same level between 2015 and Jan 2020. But, there was a similar slope in the increase between 2010 and 2015.
I wonder what other factors might play in to increases/decreases of “disability”. Is there an economic factor to it?
“Well, my back hurts but I’m making good money so I’ll keep working.”
“I can barely make ends meet with this lousy job and no good prospects. I think now is the time to get a note from my doctor about my bad back and go on disability.”
But yeah - the VAX sure seems like the obvious one here.