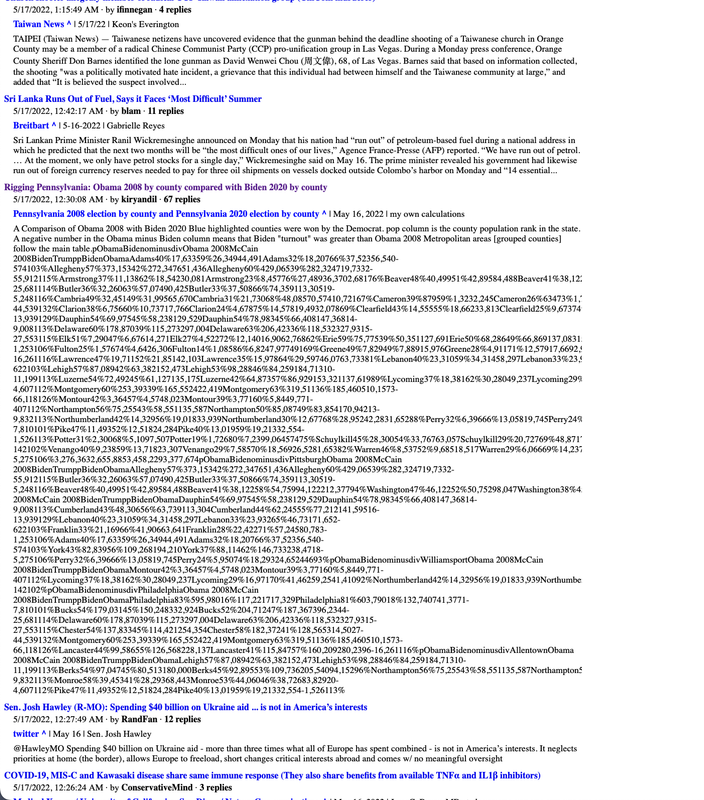
Posted on 05/16/2022 9:30:08 PM PDT by kiryandil
Metropolitan areas [grouped counties] follow the main table.
| p | Obama | Biden | |||||||||||||
| o | minus | div | |||||||||||||
| Obama 2008 | McCain 2008 | Biden | Trump | p | Biden | Obama | |||||||||
| Adams | 40% | 17,633 | 59% | 26,349 | 44,491 | Adams | 32% | 18,207 | 66% | 37,523 | 56,540 | -574 | 103% | ||
| Allegheny | 57% | 373,153 | 42% | 272,347 | 651,436 | Allegheny | 60% | 429,065 | 39% | 282,324 | 719,733 | 2 | -55,912 | 115% | |
| Armstrong | 37% | 11,138 | 62% | 18,542 | 30,081 | Armstrong | 23% | 8,457 | 76% | 27,489 | 36,370 | 2,681 | 76% | ||
| Beaver | 48% | 40,499 | 51% | 42,895 | 84,488 | Beaver | 41% | 38,122 | 58% | 54,759 | 94,122 | 21 | 2,377 | 94% | |
| Bedford | 27% | 6,059 | 72% | 16,124 | 22,443 | Bedford | 16% | 4,367 | 84% | 23,025 | 27,574 | 1,692 | 72% | ||
| Berks | 54% | 97,047 | 45% | 80,513 | 180,000 | Berks | 45% | 92,895 | 53% | 109,736 | 205,540 | 9 | 4,152 | 96% | |
| Blair | 37% | 19,813 | 62% | 32,708 | 53,102 | Blair | 28% | 17,636 | 71% | 45,306 | 63,595 | 2,177 | 89% | ||
| Bradford | 40% | 10,306 | 58% | 15,057 | 25,787 | Bradford | 27% | 8,046 | 72% | 21,600 | 30,159 | 2,260 | 78% | ||
| Bucks | 54% | 179,031 | 45% | 150,248 | 332,924 | Bucks | 52% | 204,712 | 47% | 187,367 | 396,234 | 4 | -25,681 | 114% | |
| Butler | 36% | 32,260 | 63% | 57,074 | 90,425 | Butler | 33% | 37,508 | 66% | 74,359 | 113,305 | 19 | -5,248 | 116% | |
| Cambria | 49% | 32,451 | 49% | 31,995 | 65,670 | Cambria | 31% | 21,730 | 68% | 48,085 | 70,574 | 10,721 | 67% | ||
| Cameron | 39% | 879 | 59% | 1,323 | 2,245 | Cameron | 26% | 634 | 73% | 1,771 | 2,434 | 245 | 72% | ||
| Carbon | 50% | 13,464 | 48% | 12,957 | 26,923 | Carbon | 33% | 11,212 | 65% | 21,984 | 33,629 | 2,252 | 83% | ||
| Centre | 55% | 41,950 | 44% | 32,992 | 75,763 | Centre | 52% | 40,055 | 47% | 36,372 | 77,493 | 1,895 | 95% | ||
| Chester | 54% | 137,833 | 45% | 114,421 | 254,354 | Chester | 58% | 182,372 | 41% | 128,565 | 314,502 | 7 | -44,539 | 132% | |
| Clarion | 38% | 6,756 | 60% | 10,737 | 17,766 | Clarion | 24% | 4,678 | 75% | 14,578 | 19,493 | 2,078 | 69% | ||
| Clearfield | 43% | 14,555 | 55% | 18,662 | 33,813 | Clearfield | 25% | 9,673 | 74% | 29,203 | 39,422 | 4,882 | 66% | ||
| Clinton | 48% | 7,097 | 51% | 7,504 | 14,791 | Clinton | 31% | 5,502 | 68% | 11,902 | 17,625 | 1,595 | 78% | ||
| Columbia | 47% | 13,230 | 52% | 14,477 | 28,063 | Columbia | 34% | 10,532 | 64% | 20,098 | 31,171 | 2,698 | 80% | ||
| Crawford | 44% | 16,780 | 54% | 20,750 | 38,134 | Crawford | 31% | 12,924 | 68% | 28,559 | 42,004 | 3,856 | 77% | ||
| Cumberland | 43% | 48,306 | 56% | 63,739 | 113,304 | Cumberland | 44% | 62,245 | 55% | 77,212 | 141,595 | 16 | -13,939 | 129% | |
| Dauphin | 54% | 69,975 | 45% | 58,238 | 129,529 | Dauphin | 54% | 78,983 | 45% | 66,408 | 147,368 | 14 | -9,008 | 113% | |
| Delaware | 60% | 178,870 | 39% | 115,273 | 297,004 | Delaware | 63% | 206,423 | 36% | 118,532 | 327,931 | 5 | -27,553 | 115% | |
| Elk | 51% | 7,290 | 47% | 6,676 | 14,271 | Elk | 27% | 4,522 | 72% | 12,140 | 16,906 | 2,768 | 62% | ||
| Erie | 59% | 75,775 | 39% | 50,351 | 127,691 | Erie | 50% | 68,286 | 49% | 66,869 | 137,083 | 15 | 7,489 | 90% | |
| Fayette | 49% | 25,866 | 50% | 26,081 | 52,560 | Fayette | 33% | 20,444 | 66% | 41,227 | 62,139 | 5,422 | 79% | ||
| Forest | 42% | 1,038 | 56% | 1,366 | 2,444 | Forest | 28% | 728 | 71% | 1,882 | 2,646 | 310 | 70% | ||
| Franklin | 33% | 21,169 | 66% | 41,906 | 63,641 | Franklin | 28% | 22,422 | 71% | 57,245 | 80,783 | -1,253 | 106% | ||
| Fulton | 25% | 1,576 | 74% | 4,642 | 6,306 | Fulton | 14% | 1,085 | 86% | 6,824 | 7,977 | 491 | 69% | ||
| Greene | 49% | 7,829 | 49% | 7,889 | 15,976 | Greene | 28% | 4,911 | 71% | 12,579 | 17,669 | 2,918 | 63% | ||
| Huntingdon | 36% | 6,621 | 63% | 11,745 | 18,632 | Huntingdon | 24% | 5,445 | 75% | 17,061 | 22,792 | 1,176 | 82% | ||
| Indiana | 46% | 17,065 | 53% | 19,727 | 37,302 | Indiana | 31% | 12,634 | 68% | 28,089 | 41,198 | 4,431 | 74% | ||
| Jefferson | 34% | 6,447 | 64% | 12,057 | 18,802 | Jefferson | 20% | 4,527 | 79% | 17,960 | 22,824 | 1,920 | 70% | ||
| Juniata | 32% | 3,068 | 67% | 6,484 | 9,711 | Juniata | 19% | 2,253 | 80% | 9,649 | 12,043 | 815 | 73% | ||
| Lackawanna | 63% | 67,520 | 37% | 39,488 | 107,876 | Lackawanna | 54% | 61,991 | 45% | 52,334 | 115,410 | 17 | 5,529 | 92% | |
| Lancaster | 44% | 99,586 | 55% | 126,568 | 228,137 | Lancaster | 41% | 115,847 | 57% | 160,209 | 280,239 | 6 | -16,261 | 116% | |
| Lawrence | 47% | 19,711 | 52% | 21,851 | 42,103 | Lawrence | 35% | 15,978 | 64% | 29,597 | 46,076 | 3,733 | 81% | ||
| Lebanon | 40% | 23,310 | 59% | 34,314 | 58,297 | Lebanon | 33% | 23,932 | 65% | 46,731 | 71,652 | -622 | 103% | ||
| Lehigh | 57% | 87,089 | 42% | 63,382 | 152,473 | Lehigh | 53% | 98,288 | 46% | 84,259 | 184,713 | 10 | -11,199 | 113% | |
| Luzerne | 54% | 72,492 | 45% | 61,127 | 135,175 | Luzerne | 42% | 64,873 | 57% | 86,929 | 153,321 | 13 | 7,619 | 89% | |
| Lycoming | 37% | 18,381 | 62% | 30,280 | 49,237 | Lycoming | 29% | 16,971 | 70% | 41,462 | 59,254 | 1,410 | 92% | ||
| Mckean | 41% | 6,465 | 58% | 9,224 | 15,947 | McKean | 26% | 5,098 | 72% | 14,083 | 19,466 | 1,367 | 79% | ||
| Mercer | 49% | 26,411 | 49% | 26,565 | 53,821 | Mercer | 36% | 21,067 | 62% | 36,143 | 57,954 | 5,344 | 80% | ||
| Mifflin | 33% | 5,375 | 66% | 10,929 | 16,502 | Mifflin | 21% | 4,603 | 78% | 16,670 | 21,502 | 772 | 86% | ||
| Monroe | 58% | 39,453 | 41% | 28,293 | 68,443 | Monroe | 53% | 44,060 | 46% | 38,726 | 83,829 | 20 | -4,607 | 112% | |
| Montgomery | 60% | 253,393 | 39% | 165,552 | 422,419 | Montgomery | 63% | 319,511 | 36% | 185,460 | 510,157 | 3 | -66,118 | 126% | |
| Montour | 42% | 3,364 | 57% | 4,574 | 8,023 | Montour | 39% | 3,771 | 60% | 5,844 | 9,771 | -407 | 112% | ||
| Northampton | 56% | 75,255 | 43% | 58,551 | 135,587 | Northampton | 50% | 85,087 | 49% | 83,854 | 170,942 | 13 | -9,832 | 113% | |
| Northumberland | 42% | 14,329 | 56% | 19,018 | 33,939 | Northumberland | 30% | 12,677 | 68% | 28,952 | 42,283 | 1,652 | 88% | ||
| Perry | 32% | 6,396 | 66% | 13,058 | 19,745 | Perry | 24% | 5,950 | 74% | 18,293 | 24,652 | 446 | 93% | ||
| Philadelphia | 83% | 595,980 | 16% | 117,221 | 717,329 | Philadelphia | 81% | 603,790 | 18% | 132,740 | 741,377 | 1 | -7,810 | 101% | |
| Pike | 47% | 11,493 | 52% | 12,518 | 24,284 | Pike | 40% | 13,019 | 59% | 19,213 | 32,554 | -1,526 | 113% | ||
| Potter | 31% | 2,300 | 68% | 5,109 | 7,507 | Potter | 19% | 1,726 | 80% | 7,239 | 9,064 | 574 | 75% | ||
| Schuylkill | 45% | 28,300 | 54% | 33,767 | 63,057 | Schuylkill | 29% | 20,727 | 69% | 48,871 | 70,603 | 7,573 | 73% | ||
| Snyder | 35% | 5,382 | 64% | 9,900 | 15,479 | Snyder | 26% | 4,910 | 73% | 13,983 | 19,140 | 472 | 91% | ||
| Somerset | 37% | 12,878 | 62% | 21,686 | 35,168 | Somerset | 21% | 8,654 | 78% | 31,466 | 40,543 | 4,224 | 67% | ||
| Sullivan | 40% | 1,233 | 59% | 1,841 | 3,120 | Sullivan | 26% | 921 | 73% | 2,619 | 3,595 | 312 | 75% | ||
| Susquehanna | 43% | 8,381 | 55% | 10,633 | 19,286 | Susquehanna | 29% | 6,236 | 70% | 15,207 | 21,752 | 2,145 | 74% | ||
| Tioga | 36% | 6,390 | 63% | 11,326 | 17,984 | Tioga | 24% | 4,955 | 75% | 15,742 | 21,075 | 1,435 | 78% | ||
| Union | 42% | 7,333 | 57% | 9,859 | 17,400 | Union | 37% | 7,475 | 61% | 12,356 | 20,115 | -142 | 102% | ||
| Venango | 40% | 9,238 | 59% | 13,718 | 23,307 | Venango | 29% | 7,585 | 70% | 18,569 | 26,528 | 1,653 | 82% | ||
| Warren | 46% | 8,537 | 52% | 9,685 | 18,517 | Warren | 29% | 6,066 | 69% | 14,237 | 20,650 | 2,471 | 71% | ||
| Washington | 47% | 46,122 | 52% | 50,752 | 98,047 | Washington | 38% | 45,088 | 61% | 72,080 | 118,478 | 18 | 1,034 | 98% | |
| Wayne | 43% | 9,892 | 56% | 12,702 | 22,835 | Wayne | 33% | 9,191 | 66% | 18,637 | 28,089 | 701 | 93% | ||
| Westmoreland | 41% | 72,721 | 58% | 102,294 | 176,873 | Westmoreland | 35% | 72,129 | 64% | 130,218 | 204,697 | 11 | 592 | 99% | |
| Wyoming | 46% | 5,985 | 53% | 6,983 | 13,138 | Wyoming | 32% | 4,704 | 67% | 9,936 | 14,858 | 1,281 | 79% | ||
| York | 43% | 82,839 | 56% | 109,268 | 194,210 | York | 37% | 88,114 | 62% | 146,733 | 238,471 | 8 | -5,275 | 106% | |
| 3,276,363 | 2,655,885 | 3,458,229 | 3,377,674 | ||||||||||||
| p | Obama | Biden | |||||||||||||
| o | minus | div | |||||||||||||
| Pittsburgh | Obama 2008 | McCain 2008 | Biden | Trump | p | Biden | Obama | ||||||||
| Allegheny | 57% | 373,153 | 42% | 272,347 | 651,436 | Allegheny | 60% | 429,065 | 39% | 282,324 | 719,733 | 2 | -55,912 | 115% | |
| Butler | 36% | 32,260 | 63% | 57,074 | 90,425 | Butler | 33% | 37,508 | 66% | 74,359 | 113,305 | 19 | -5,248 | 116% | |
| Beaver | 48% | 40,499 | 51% | 42,895 | 84,488 | Beaver | 41% | 38,122 | 58% | 54,759 | 94,122 | 21 | 2,377 | 94% | |
| Washington | 47% | 46,122 | 52% | 50,752 | 98,047 | Washington | 38% | 45,088 | 61% | 72,080 | 118,478 | 18 | 1,034 | 98% | |
| Westmoreland | 41% | 72,721 | 58% | 102,294 | 176,873 | Westmoreland | 35% | 72,129 | 64% | 130,218 | 204,697 | 11 | 592 | 99% | |
| p | Obama | Biden | |||||||||||||
| o | minus | div | |||||||||||||
| Harrisburg | Obama 2008 | McCain 2008 | Biden | Trump | p | Biden | Obama | ||||||||
| Dauphin | 54% | 69,975 | 45% | 58,238 | 129,529 | Dauphin | 54% | 78,983 | 45% | 66,408 | 147,368 | 14 | -9,008 | 113% | |
| Cumberland | 43% | 48,306 | 56% | 63,739 | 113,304 | Cumberland | 44% | 62,245 | 55% | 77,212 | 141,595 | 16 | -13,939 | 129% | |
| Lebanon | 40% | 23,310 | 59% | 34,314 | 58,297 | Lebanon | 33% | 23,932 | 65% | 46,731 | 71,652 | -622 | 103% | ||
| Franklin | 33% | 21,169 | 66% | 41,906 | 63,641 | Franklin | 28% | 22,422 | 71% | 57,245 | 80,783 | -1,253 | 106% | ||
| Adams | 40% | 17,633 | 59% | 26,349 | 44,491 | Adams | 32% | 18,207 | 66% | 37,523 | 56,540 | -574 | 103% | ||
| York | 43% | 82,839 | 56% | 109,268 | 194,210 | York | 37% | 88,114 | 62% | 146,733 | 238,471 | 8 | -5,275 | 106% | |
| Perry | 32% | 6,396 | 66% | 13,058 | 19,745 | Perry | 24% | 5,950 | 74% | 18,293 | 24,652 | 446 | 93% | ||
| p | Obama | Biden | |||||||||||||
| o | minus | div | |||||||||||||
| Williamsport | Obama 2008 | McCain 2008 | Biden | Trump | p | Biden | Obama | ||||||||
| Montour | 42% | 3,364 | 57% | 4,574 | 8,023 | Montour | 39% | 3,771 | 60% | 5,844 | 9,771 | -407 | 112% | ||
| Lycoming | 37% | 18,381 | 62% | 30,280 | 49,237 | Lycoming | 29% | 16,971 | 70% | 41,462 | 59,254 | 1,410 | 92% | ||
| Northumberland | 42% | 14,329 | 56% | 19,018 | 33,939 | Northumberland | 30% | 12,677 | 68% | 28,952 | 42,283 | 1,652 | 88% | ||
| Snyder | 35% | 5,382 | 64% | 9,900 | 15,479 | Snyder | 26% | 4,910 | 73% | 13,983 | 19,140 | 472 | 91% | ||
| Union | 42% | 7,333 | 57% | 9,859 | 17,400 | Union | 37% | 7,475 | 61% | 12,356 | 20,115 | -142 | 102% | ||
| p | Obama | Biden | |||||||||||||
| o | minus | div | |||||||||||||
| Philadelphia | Obama 2008 | McCain 2008 | Biden | Trump | p | Biden | Obama | ||||||||
| Philadelphia | 83% | 595,980 | 16% | 117,221 | 717,329 | Philadelphia | 81% | 603,790 | 18% | 132,740 | 741,377 | 1 | -7,810 | 101% | |
| Bucks | 54% | 179,031 | 45% | 150,248 | 332,924 | Bucks | 52% | 204,712 | 47% | 187,367 | 396,234 | 4 | -25,681 | 114% | |
| Delaware | 60% | 178,870 | 39% | 115,273 | 297,004 | Delaware | 63% | 206,423 | 36% | 118,532 | 327,931 | 5 | -27,553 | 115% | |
| Chester | 54% | 137,833 | 45% | 114,421 | 254,354 | Chester | 58% | 182,372 | 41% | 128,565 | 314,502 | 7 | -44,539 | 132% | |
| Montgomery | 60% | 253,393 | 39% | 165,552 | 422,419 | Montgomery | 63% | 319,511 | 36% | 185,460 | 510,157 | 3 | -66,118 | 126% | |
| Lancaster | 44% | 99,586 | 55% | 126,568 | 228,137 | Lancaster | 41% | 115,847 | 57% | 160,209 | 280,239 | 6 | -16,261 | 116% | |
| p | Obama | Biden | |||||||||||||
| o | minus | div | |||||||||||||
| Allentown | Obama 2008 | McCain 2008 | Biden | Trump | p | Biden | Obama | ||||||||
| Lehigh | 57% | 87,089 | 42% | 63,382 | 152,473 | Lehigh | 53% | 98,288 | 46% | 84,259 | 184,713 | 10 | -11,199 | 113% | |
| Berks | 54% | 97,047 | 45% | 80,513 | 180,000 | Berks | 45% | 92,895 | 53% | 109,736 | 205,540 | 9 | 4,152 | 96% | |
| Northampton | 56% | 75,255 | 43% | 58,551 | 135,587 | Northampton | 50% | 85,087 | 49% | 83,854 | 170,942 | 13 | -9,832 | 113% | |
| Monroe | 58% | 39,453 | 41% | 28,293 | 68,443 | Monroe | 53% | 44,060 | 46% | 38,726 | 83,829 | 20 | -4,607 | 112% | |
| Pike | 47% | 11,493 | 52% | 12,518 | 24,284 | Pike | 40% | 13,019 | 59% | 19,213 | 32,554 | -1,526 | 113% |
you are becoming more and more unhinged.
That would be a huge task to undertake. Do you have any specific examples? But as I think on that, if the fraud was undertaken at specific drop boxes by mules, then precinct boundaries may not necessarily be a factor.
Some states have very usable precinct numbers, whereas others have extremely unfriendly data, if it's available at all.
We have to remember also [as Erik points out with precinct data being better] that the county data is not cut-and-dried, because some counties are split between congressional districts, both locally and at the national level.
Thank you for your informative post, and I appreciate what must have been considerable effort in putting it all together.
They had to use ballots made out to registered voters, otherwise, they ran the risk of the fraud being uncovered.
So, you can see turnout in blue precincts was near 100%.
Lots to digest here!
I was focused on getting the four separate parts of the post up before a troll weighed in to disrupt the thread. Plus, you don't get to see how it looks on the main page before you pull the trigger.
As it was, I was right to be wary of vote-fraud-denying trolls - one jumped on within 5 minutes of the last of my initial posts, to cr@p up the thread and obfuscate the point.
I didn't even do the Senate or House races.
There's hanky-panky there, too. As Erik pointed out, ALL the state-wide races are at risk with this method.
I discovered a Minnesota US House race [Minnesota's 7th CD and Collin Peterson] where a 30-year conservative Democrat lost because he was outside the rigging zone of the Minnesota ballot mules.
I didn’t check in to good old FR until about an hour ago. So I missed all the fun.
But the post itself is brilliant and, I would say, invaluable to we Freepers. The fraud just jumps off the page.
Donations are fine but that’s nobody’s business but yours. It is posts like this one that are the real value that FR provides. It is what brings us all back everyday.
Well, you did a monumental job, and sorry to be a pest over it. Thank you for sharing all your work, kiryandil.
And thanks for the thanks! :)
Thanks kiryandil.
?? ??
The ability to gerrymander by race and culture (er, number of illegal aliens) begins in the 2000 census under Clinton’s minions and NGO “paid census volunteers” and was expanded by 2010 census under Obama when his walkers went around completely un-monitored and unobserved inventing people in abandoned buildings and burned out wrecks.
Thus, the lawsuits by radicals: “Imputed counts” - since “everybody knows” the poor and downtrodden are afraid to talk to the government!
This is good. Thanks for doing this.
Disclaimer: Opinions posted on Free Republic are those of the individual posters and do not necessarily represent the opinion of Free Republic or its management. All materials posted herein are protected by copyright law and the exemption for fair use of copyrighted works.