Percentage is findable, but I'm currently lazy. CO2 concentration is about 370 ppm and increasing.
What percentage was it 10, 20, 30, 50 years ago?
I take it you haven't ever heard of the Keeling Mauna Loa CO2 curve?

Percentage is findable, but I'm currently lazy. CO2 concentration is about 370 ppm and increasing.
What percentage was it 10, 20, 30, 50 years ago?
I take it you haven't ever heard of the Keeling Mauna Loa CO2 curve?
This is explained in the article I linked to in post 51 and it has more information which helps to put the situation in perspective.
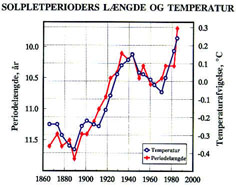
This correlation of the length of the solar cycle does a much better job of explaining the up and down observed global temperature than the steadily increasing CO2 concentration. (Pardon the Danish, or whatever language the chart contains.)
I've heard that the Friis-Christensen/Lassen correlation did not perform as well over the last 10 years or so as it did before 1991. The observed temperature curve went higher than the solar correlation during this recent period. On the other hand, that sort of mismatch (observed temperature > solar correlation) has happened before at the ends of pre-1860 up-cycles in global temperature (other authors have extended this solar correlation back centuries in time).
The length of the solar cycle is a good proxy for solar radiation but apparently not a perfect one.