To: palmer
The ballots cast has the same curve as registered voters except for a smaller percentage of the younger voters and a higher percentage of older voters. How is that evidence of fraud? What is a "correlation factor" of 1.000? Someone else asked for the algorithm, I woulld say I don't want to know. This whole thing is a complete waste of time. The physics guy was not convincing, and Mike Lindell knows absolutely nothing. The formula for calculating correlation is: 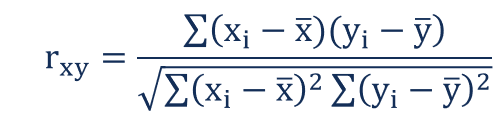 The correlation between ballots cast and registrations for all counties in Ohio is .9993109593 which is of course EXACTLY what one would expect. You will notice he doesn't apply his curve fitting formula to counties like Geauga or Athens which had high and low turnouts respectively. So no, it's not evidence of fraud. It means turnout is reemarkably consistent across the State and across age groups. That's not weird or odd. Lindell is brain dead stupid, and Dr. Frank has to be a FRAUD in order to MISUSE correlation in such a manner.
Lets not forget that Ohio uses around seven different voting machine vendors[*] with at least three different methods of voting all using different software. This would require hundreds of lizard people embedded into all these companies and all 88 counties to enter Dr. Frank's magic "Sixth degree polynomial equation".
[*] ftp://sosftp.sos.state.oh.us/free/publications/website/maps/votingSystems.pdf
To: Rightwing Conspiratr1
“The formula for calculating correlation is: The correlation between ballots cast and registrations for all counties in Ohio is .9993109593 which is of course EXACTLY what one would expect. “ -rwc1
No - not ever in the real world with real independent data would one expect a correlation that high.
0.8 is really strong; 0.95 amazing; 0.999 fantasy-with real data even when there is a expected behavioral relationship. This is not testing a physical property, like sunrise to change in brightness. This is behavior.
218 posted on
08/11/2021 7:28:51 AM PDT by
Triple
(Socialism denies people the right to the fruits of their labor, and is as abhorrent as slavery)
FreeRepublic.com is powered by software copyright 2000-2008 John Robinson