Posted on 01/03/2021 5:50:42 AM PST by blam


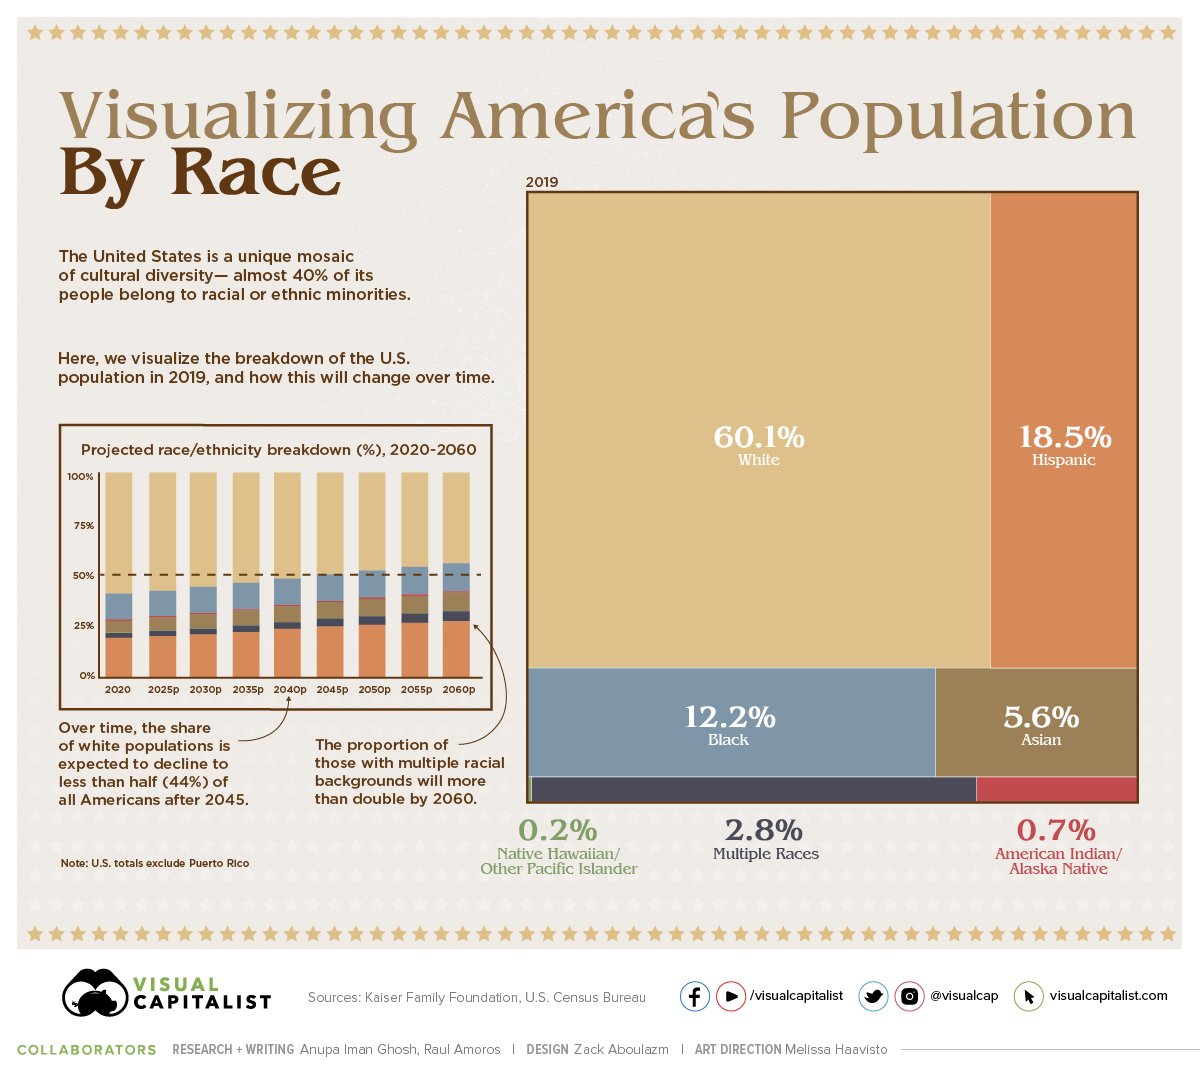
The American population is a unique mosaic of cultures—and almost 40% of people identify as racial or ethnic minorities today.
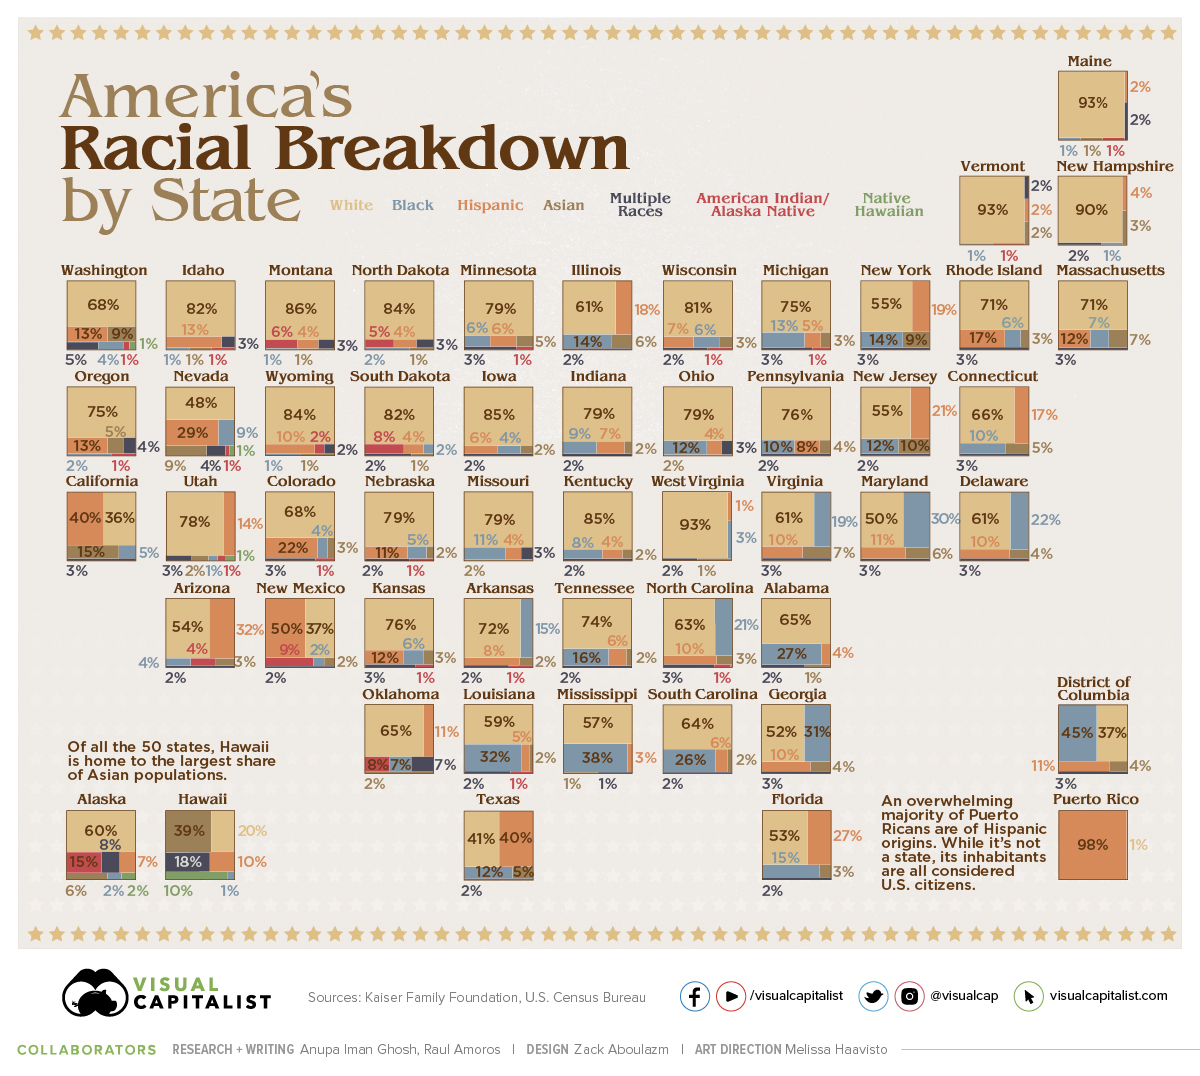
In this treemap, we use data for 2019 from the Kaiser Family Foundation, which bases its analysis on the latest American Community Survey (ACS) data from the U.S. Census Bureau. Then we break down the same data on a state-by-state basis.
Growing Diversity in America
As of 2019, here is the current distribution of the U.S. population by race and ethnicity:
•White: 60.1% (Non-Hispanic)
•Hispanic: 18.5%
•Black: 12.2%
•Asian: 5.6%
•Multiple Races: 2.8%
•American Indian/Alaska Native: 0.7%
•Native Hawaiian/Other Pacific Islander: 0.2%
Note that the U.S. totals do not include Puerto Rico.
However, these race and ethnicity projections are expected to change over the coming years. By the year 2060, it’s expected that the distribution of Non-Hispanic Whites as a percentage of total population will fall from 60.1% to 44.3% of Americans.
Year White* Hispanic Black Asian Multiple Races Other**
2020 59.7% 12.5% 18.7% 5.8% 2.3% .9%
2025 57.7% 12.7% 19.9% 6.3% 2.6% 0.9%
2030 55.8% 12.8% 21.1% 6.7% 2.8% 0.9%
2035 53.8% 12.9% 22.3% 7.1% 3.1% 0.9%
2040 51.7% 13.0% 23.5% 7.5% 3.4% 0.9%
2045 49.7% 13.1% 24.6% 7.9% 3.8% 0.9%
2050 47.8% 13.3% 25.7% 8.2% 4.1% 0.9%
2055 46.0% 13.4% 26.6% 8.5% 4.5% 0.9%
2060 44.3% 13.6% 27.5% 8.9% 4.9% 0.9%
Source: U.S. Census Bureau. *Excludes Hispanics **Other includes American Indian/Alaska Native (0.7%) and Native Hawaiian/Pacific Islander (0.2%). Both proportions remain unchanged in these projections.
Interestingly, the proportion of those from multiple racial and ethnic backgrounds will more than double, from 2.3% to 4.9% alongside rising patterns of interracial marriage.
Over time, the U.S. Census has been vastly expanded to reflect the true diversity that the country holds. In fact, it was only from 1960 onwards that people could select their own race—and only from 2020 can those who chose White or Black provide further information on their roots.
A State-by-State Breakdown
Of course, racial diversity in the United States differs widely from region to region.
In the Northeast—particularly the states Maine, Vermont, and New Hampshire—the Non-Hispanic White population accounts for 90% or more of the total. In contrast, Black populations are highest in the District of Columbia (45%) and several Southern states.
Search:
Location
White
Black
Hispanic
Asian
Multiple Races
American Indian /Alaska Native
Native Hawaiian /Other Pacific Islander
Alabama 65% 27% 4% 1% 2% 0% -
Alaska 60% 2% 7% 6% 8% 15% 2%
Arizona 54% 4% 32% 3% 2% 4% 0%
Arkansas 72% 15% 8% 2% 2% 1% 0%
California 36% 5% 40% 15% 3% 0% 0%
Colorado 68% 4% 22% 3% 3% 1% 0%
Connecticut 66% 10% 17% 5% 3% 0% -
Delaware 61% 22% 10% 4% 3% 0% -
District of Columbia 37% 45% 11% 4% 3% 0% -
Florida 53% 15% 27% 3% 2% 0% 0%
Georgia 52% 31% 10% 4% 3% 0% 0%
U.S.
60.1%
12.2%
18.5%
5.6%
2.8%
0.7%
0.2%
Note: A dash (-) indicates estimates with relative standard errors greater than 30%, which were not included in the data
Of all the 50 states, Hawaii is home to the largest share of Asian populations at 39%. It also has one of the most diverse racial breakdowns in the nation overall, including the highest proportion of mixed race individuals.
Looking to another island, an overwhelming majority (98%) of Puerto Ricans are of Hispanic origins. While it’s not a state, its inhabitants are all considered U.S. citizens.
Charting the U.S. population by race is crucial for a number of reasons. This information can be used to better understand existing income and wealth gaps, track public health outcomes, and to aid in policy decision-making at higher levels.
We become not a melting pot but a beautiful mosaic. Different people, different beliefs, different yearnings, different hopes, different dreams.
—Jimmy Carter, 39th President of the U.S.
Editor’s note: This article has been updated to better reflect U.S. Census Bureau categories.
Strictly speaking, the Hispanic is not a race and should be an overlay of some of the others.
Unfortunately, in the 2020 election, only 26% of non-white voters supported Trump, who, in fact, is more centrist than Conservative.
The Republican Party has committed political suicide by supporting 35 years of massive legal immigration and a half dozen Amnesties.
Great statistical aggregation. Thanks for posting.
A little anecdote - my wife who is/was Russian, was shocked by this. She assumed, given the high concentration of Blacks in the media, sports, movies and politics, that the breakdown was at least 50/50 for whites and blacks.
I had to admonish her, and remind her of her White Privilege, as we drove off to our second jobs.
btt
“Crazy that 3 states with plus 90 percent white are big time democrat states.”
___________________________________________________________________________________
I guess Blacks & Hispanics just don’t like LOTS of real snow...!
Wow what a waste of time. Everyone knows that skin color is irrelevant. It’s the size of the nostrils that is the real tell. /sarcasm
I disagree. I’ve given up on blacks.
Republicans should make no effort for their votes. Let the dems have it. The republicans won’t get any less than they’re getting. Focus strictly on Latino/Hispanic and Asians. Trump did far more for blacks than obama ever did and got nothing in return.
If you make black votes not matter, blacks might would start to rethink things. They might start thinking what’s best for them, the nation, and everyone else. They might start thinking about real issues instead of voting as they’re told to vote.
I don’t mean be racist or anything like that to blacks. We just need to quit pandering to them. That has gotten us no where. Treat them like everyone should be treated.
I believe that before 1965 or thereabouts Hispanics were included as white in demographic statistics and not a separate category. Anyone who can correct this if it’s wrong is welcome to do so. Also, almost by definition Hispanics are mixed race. There are some that have 100% Indian or Spanish blood but most have at least some from both groups.
And the 12.2% wags the dog.
The classic Latino I think of is basically, I guess, “Indian” (which in theory should also not be a race but really yellow). Yet Mexican and south look different to me than most of our NA Indians.
That has been the GOP's problem all along, wrongly assuming American Latinos favor illegal immigration.
They don't and never have because they are the ones most negatively impacted by it.
Problem is that the GOPe is still siding with the cheep labor express because they got big donations from big business to keep the gates open.
That is starting to change as big business and big tech have flipped to wokeness openly.
That has been the GOP’s problem all along, wrongly assuming American Latinos favor illegal immigration.
Agree. Latinos/Hispanics beliefs align more with conservatives than liberals. Most are good hard working family people with good moral/faith background.
The media and liberals have run with the narrative that if you don’t support illegals, you must be a racist. Liberals/liberals are great at labeling people and running with the narrative. They know if you repeat a lie often enough, people will believe it.
Misdirection and lies. Hispanic is not a race or a tribe. White and Blacks are tribes. Asians are of geographic origin not a race and Hispanic is a language not a race. Apples to oranges- to twist information to confuse and prove that the White tribe is losing ground (their country).
Many Hispanic speaking people are whiter than Italians or Greeks. This is a false comparison of tribes in America.
Wonder if DMA tests would change the stats.
bttt
I see no point in pandering to blacks (or anyone else); I believe Trump’s slightly improved showing with them was not because he pandered, but a slowly growing number want the future he envisioned for this country - increased opportunity and the corresponding increased wealth.
The great showing he had with Hispanics was because his agenda sells itself; they also want increased prosperity, not just welfare on an urban reservation.
Disclaimer: Opinions posted on Free Republic are those of the individual posters and do not necessarily represent the opinion of Free Republic or its management. All materials posted herein are protected by copyright law and the exemption for fair use of copyrighted works.