Covid-19 has killed 50,000 in a month and a half. Do the math.
Note 1: These graphs are not models, projections, forecasts or theories. These are log graphs of data. This has already happened.
Note 2: Nobody, including the graphologist, believes Chinese or Iranian numbers. His job is to plot the official reported numbers, not to inject his own slant. On his Twitter feed, he explains all this in great detail. John Burn-Murdoch @jburnmurdoch
Note 3: You can dispute the numbers of "real" covid cases etc, but it's still useful to observe trends based on consistent methodology.
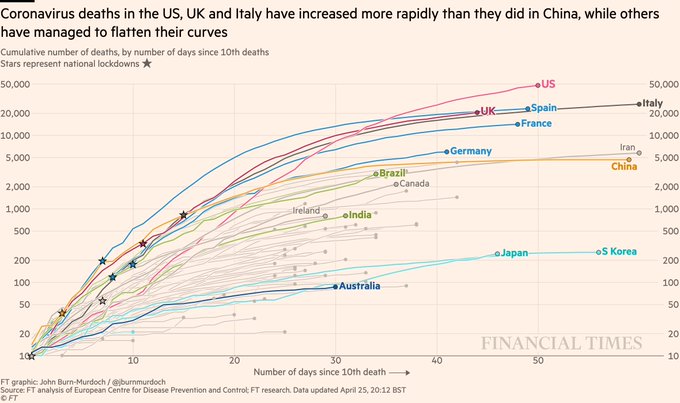
Cumulative deaths.
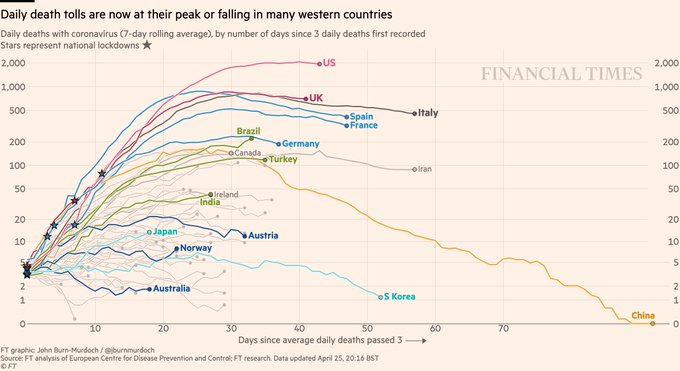
Daily deaths, 7 day rolling average.