You're right to be concerned w/ inflation w/ investment planning. 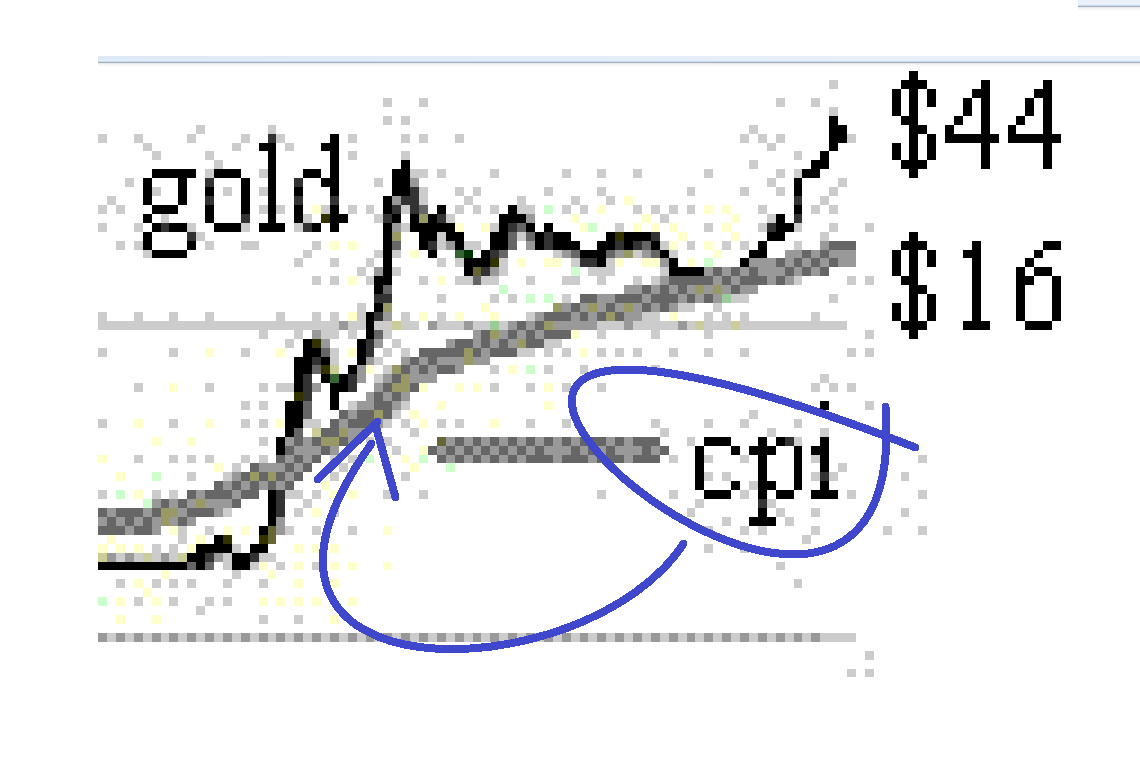
Down in the lower right hand corner of the numbers is a grey line labeled "cpi" --the consumer price index.
It shows that a one dollar purchase in 1800 of the standard market basket of the index would be worth about $16 in current dollars.
We get an idea of the last 40 years of returns by seeing how that time-frame shows a tripling of inflation, a 20-increase in the price of gold, and a 10,000% increase in sales price of a bunch of Dow Jones stocks + dividends.
Since the past four-decade returns has been fairly typical of what we've had over the past two centuries it's reasonable to plan that the next 40 years can be much the same.