To: DiogenesLamp
Did you notice the ".gov" ?Yeah, who am I gonna believe, an entire agency that actually collects this sort of data or some dude who thinks tuna represents the entirety of consumer prices?
Are you seriously pushing an Obama chart on us as proof that Obama is telling the truth about inflation?
Are you seriously claiming that consumer prices doubled, during the weakest recovery in history? Obama can fudge all the numbers he wants, that still doesn't help your claim.
60 posted on
10/22/2015 2:02:01 PM PDT by
Toddsterpatriot
("Telling the government to lower trade barriers to zero...is government interference" central_va)
To: Toddsterpatriot; DiogenesLamp
I find this as my main source for looking at inflation. This basket of goods is based in Indianapolis. I am sure it varies with different cities.
http://www.thepeoplehistory.com/pricebasket.html
The link has details as to what was used to calculate the prices.
------------------
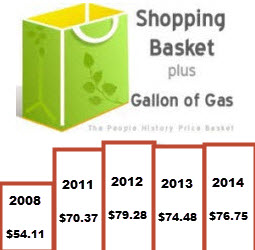
Our Price Basket - or Cost Of Living 2008 - 2014 Latest Inflation Update December 2014 Interest Rates, Housing, Food, Gas, Stamps, Dollar Exchange Rate, Dow Jones, Movie Ticket, College Tuition and Wages. We created this page to address two specific needs 1. Providing a comparison for earlier years and 2. As a means of watching how prices and wages react and the effects on inflation, prices and wages when the world comes out of the recession . As you can see we have changed the format to make it easier to read. Hope You Like the new style. To gain an idea of true inflation check 2008 prices to current with our Price Basket Graphic -- Steve
As you can see from our table the overall basket of goods has increased significantly from 2008 to 2014,
Our real world Price basket of goods shows an increase of over 45% from May 2008 to September 2012 far above published inflation figures and I believe reflects how the working class and the middle class have been effected by real world prices and stagnation in wages due to high unemployment, our basket is representative of the goods and services we all use and buy. Obviously different people spend on different amounts and types from our food basket dependent on multiple factors
1. Size of family, 2. Income, but we hope it offers an insight into real world inflation we are all affected by as opposed to government statistics.
Our basket of goods shows a slight increase from 2013 to 2014 which could be suprising when you consider the price of Gas has decreased ( the big factor was the increase of Tide Soap Powder ) other factors including rent, taxes ( local and State ) College Tuition, Cost of a Stamp, Movie Ticket or going out for a meal all affect how much disposable income we have available
|
 |
And even the fed numbers shows household income declining during the same years from $58,000 to $54,000.
62 posted on
10/22/2015 2:08:07 PM PDT by
ForYourChildren
(Christian Education [ RomanRoadsMedia.com - Classical Christian Approach to Homeschool ])
To: Toddsterpatriot
Yeah, who am I gonna believe, an entire agency that actually collects this sort of data or some dude who thinks tuna represents the entirety of consumer prices? If you had been buying stuff all this time, you could believe your own eyes.
But seriously, between Believing Obama.gov and some nameless mook off the street, I would go with the nameless mook every single time. Besides that, i'm not the only one saying this stuff. Look around you. A lot of other people believe the same thing.
Are you seriously claiming that consumer prices doubled, during the weakest recovery in history?
I say nearly doubled. It is not quite double in cost. But then again, It may have doubled in cost if the difference in quantity is factored in.
Seriously, do you not remember what things cost before Obama?
Obama can fudge all the numbers he wants, that still doesn't help your claim.
Even Obama.gov shows an upward trend of 25% according to you. You can bet that that is the lowest possible number which their data can be made to fit.
63 posted on
10/22/2015 2:14:18 PM PDT by
DiogenesLamp
("of parents owing allegiance to no other sovereignty.")
FreeRepublic.com is powered by software copyright 2000-2008 John Robinson