To: SeekAndFind
I watched a video of Ms Coulter and Mr. Ramos. Yes Mr. Ramos conducted himself well. But I think he ignored Ms Coulter's points.
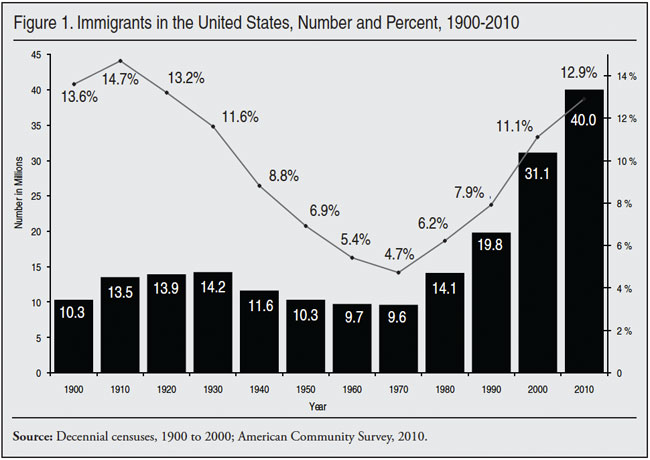
Ramos made an emphatic point about percentages and numbers. He had the percentage right and eventually got the numbers right.. 40 million.
But he seemed to brush off the point.. percentages and numbers alone do not matter -- it is culture, heritage, and language. Prior to the past few decades we could count on immigrants with knowledge of at least two of the three.
That lack could be made up with the willingness to learn and adopt. But is it there? Or do way too many cling to the mores and languages of their corrupt homeland? Especially Mexicorruption.
At least the percentages and numbers are there in federal stats.
http://www.census.gov/content/dam/Census/library/infographics/foreign_born_text.pdf
America's Foreign Born in the Last 50 Years During the last 50 years, the foreign - born population of the United States has undergone dramatic changes in size, origins, and geographic distributions. This population represented about 1 in 20 residents in 1960, mostly from countries in Europe who settled in the Northeast and Midwest. Today’s foreign - born population makes up about one in eight U.S. residents, mostly immigrants from Latin America and Asia who have settled in the West and South. The Decennial Census and the annual American Community Survey allow us to trace the changes in the foreign - born population over time.
Foreign – Born Population and as Percent of Total Population
| Decade |
Millions |
Percentage |
Europe |
N America |
Latin America |
Asia |
Other |
| 1850 |
2.2 |
9.7 % |
- |
- |
- |
- |
- |
| 1860 |
4.1 |
13.2 % |
- |
- |
- |
- |
- |
| 1870 |
5.6 |
14.4 % |
- |
- |
- |
- |
- |
| 1880 |
6.7 |
13.3 % |
- |
- |
- |
- |
- |
| 1890 |
9.2 |
14.8 % |
- |
- |
- |
- |
- |
| 1900 |
10.3 |
13.6 % |
- |
- |
- |
- |
- |
| 1910 |
13.5 |
14.7 % |
- |
- |
- |
- |
- |
| 1920 |
13.9 |
13.2 % |
- |
- |
- |
- |
- |
| 1930 |
14.2 |
11.6 % |
- |
- |
- |
- |
- |
| 1940 |
11.6 |
8.8 % |
- |
- |
- |
- |
- |
| 1950 |
10.3 |
6.9 % |
- |
- |
- |
- |
- |
| 1960 |
9.7 |
5.4 % |
75 % |
10 % |
9 % |
5 % |
1 % |
| 1970 |
9.6 |
4.7 % |
- |
- |
- |
- |
- |
| 1980 |
14.1 |
6.2 % |
- |
- |
- |
- |
- |
| 1990 |
19.8 |
7.9 % |
- |
- |
- |
- |
- |
| 2000 |
31.1 |
11.1 % |
- |
- |
- |
- |
- |
| 2010 |
40.0 |
12.9 % |
12 % |
2 % |
53 % |
28 % |
5 % |
4 posted on
05/27/2015 4:13:12 PM PDT by
WilliamofCarmichael
(If modern America's Man on Horseback is out there, Get on the damn horse already!)
To: WilliamofCarmichael
Ramos made an emphatic point about percentages and numbers. He had the percentage right and eventually got the numbers right.. 40 million. Ramos was playing a game with the percentages. He said that the percentage 90 years ago is about the same at it is today (it is) and implied that it is some sort of norm. However, as your table shows, this was a high water mark, which caused a substantial reduction of legal immigration with the 1925 Immigration Act. During the period 1920 to 1965, immigration averaged 195,000 a year. It is now 1.1 million a year.
Ann should have called him on it. In 1970 one in 21 was foreign born; today it is one in 8, the highest in 90 years; and within a decade it will be one in 7, the highest in our history. We have just had the two highest decades of immigration in American history. Over 30 million legal permanent immigrants have entered this country since 1990.
We need to reduce legal immigration no matter where the people come from.
18 posted on
05/27/2015 5:49:49 PM PDT by
kabar
FreeRepublic.com is powered by software copyright 2000-2008 John Robinson