Posted on 03/03/2011 1:50:22 PM PST by SeekAndFind
Meanwhile the underclass keeps living like the middle class, soon to be living like the upper class.
I see, you’ve never been abroad. The US is a 3rd world country since many years. It’s only gett’in closer to you.
Ping for later
The author forgot one key item. It takes capital to create jobs. Unfortunately, the economic environment in the United States under this administration is terrible. It is far less risky and much more profitable to invest in off shore corporations. Their lower taxes and minimal regulations make it very attractive.
Easier to destroy the middelclass and redistribute than it is to educate and train the lower.

Depends if one believes the government statistics on inflation used to calculate real income.
I do not.
Is that part of the Packard Complex in Deeetroit?
I didn’t get your message.
Please type it on an IBM Selectric, and put it in the mail.
Then maybe I can read it and understand you.
Otherwise, all this newfangled technology is worthless.
Put that BS up against inflation now. Defeated my ass.
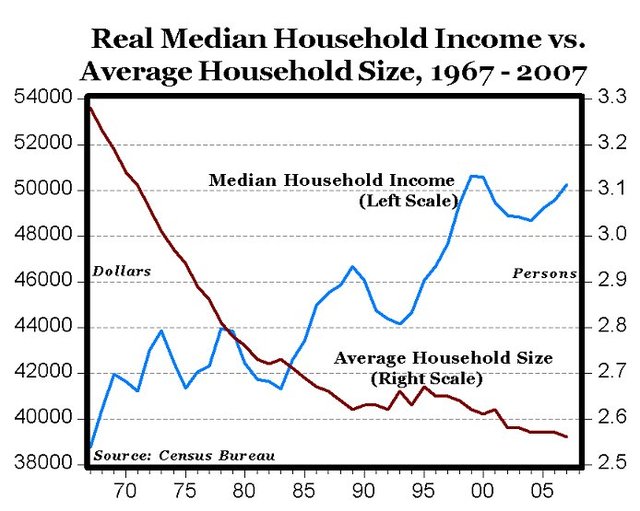
Nice graph, but remember, the financial crisis and the subprime meltdown started in 2008. Do you have the graph showing what happened after 2007?
I don’t care about America ‘waking up.’
I don’t care to whine about the situation.
This is all true and it is happening - I (and I assume most here) am one of the ‘awake’ — so I think my favorite topics on FR and other such forums address what independent minded people can and are DOING about it.
A graph showing the average income for all US households proves nothing. Do you have one that shows average household income for four of five income categories, from the lowest to the highest?
Your graph doesn’t even relate to the topic of the article: the middle class, not an overall average income.
Here's a dollar value chart for 1973-2009. Looks like about a 28% drop across the same timeframe. That easily wipes out the 19% gain in *real purchasing power per household*. (Click for link of source.)
P.S. I'd hate to see what the this chart would look like if extended to the current date.
Good Post.
“Nice graph, but remember, the financial crisis and the subprime meltdown started in 2008. Do you have the graph showing what happened after 2007?”
Are you saying “globalism” caused the ‘08 meltdown? Well, I guess I can’t argue with that, any more than I can argue against it having been caused by Satan.
“I see, you’ve never been abroad. The US is a 3rd world country since many years”
Firstly, I realize China and Cuba still exist, but there is no “Third World” anymore. That should be updated to the Second World. More importantly, who are you kidding? Americans would start the largest mass suicide in history if they were suddenly forced to live like so-called 3rd worlders.
Here is a table that illustrates what has happened to the lower categories of household income in the US since 1970: incomes have increased very little while the highest category has increased significantly, and the percentage shares of aggregate US income is shifting away from the lower groups to the higher groups.
Table #693 at the link. Not the best illustration, but it does show the impact of globalization and high legal and illegal immigration on the lower and middle classes of earners:
http://www.census.gov/compendia/statab/2011/tables/11s0693.pdf
Disclaimer: Opinions posted on Free Republic are those of the individual posters and do not necessarily represent the opinion of Free Republic or its management. All materials posted herein are protected by copyright law and the exemption for fair use of copyrighted works.