Free Republic
Browse · Search
News/Activism
Topics · Post Article

To: Yo-Yo

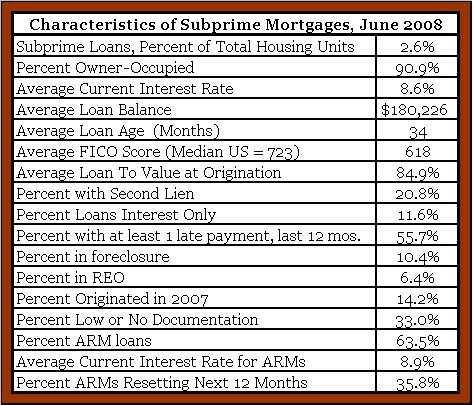
The chart above is from NY Federal Reserve data on Nonprime Mortgage Conditions in the United States for June 2008. Based on those data, the chart below shows the current distribution of housing units:

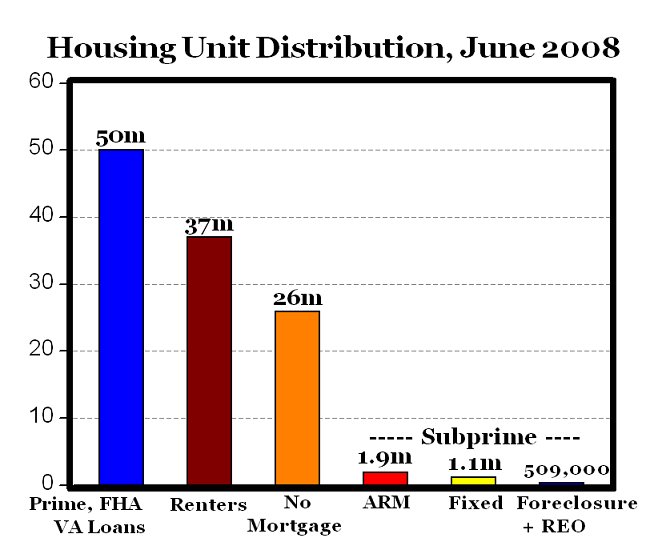
Note that the 3 million subprime mortgages represent only 2.6% of 116 million total housing units, and only 17% of subprime loans (510,000) are in foreclosure or REO. As a percent of total housing units, the subprime mortgages in foreclosure or REO represent less than 1/2 of 1 percent of all housing units (0.44%).

http://mjperry.blogspot.com/2008/08/current-subprime-mortgage-stats.html

32 posted on 10/08/2008 6:14:32 AM PDT by petercooper (IQ tests for all voters!)
[ Post Reply | Private Reply | To 26 | View Replies ]


To: petercooper

charts may not show

http://mjperry.blogspot.com/2008/08/current-subprime-mortgage-stats.html


34 posted on 10/08/2008 6:17:38 AM PDT by petercooper (IQ tests for all voters!)
[ Post Reply | Private Reply | To 32 | View Replies ]

Free Republic
Browse · Search
News/Activism
Topics · Post Article


FreeRepublic, LLC, PO BOX 9771, FRESNO, CA 93794
FreeRepublic.com is powered by software copyright 2000-2008 John Robinson