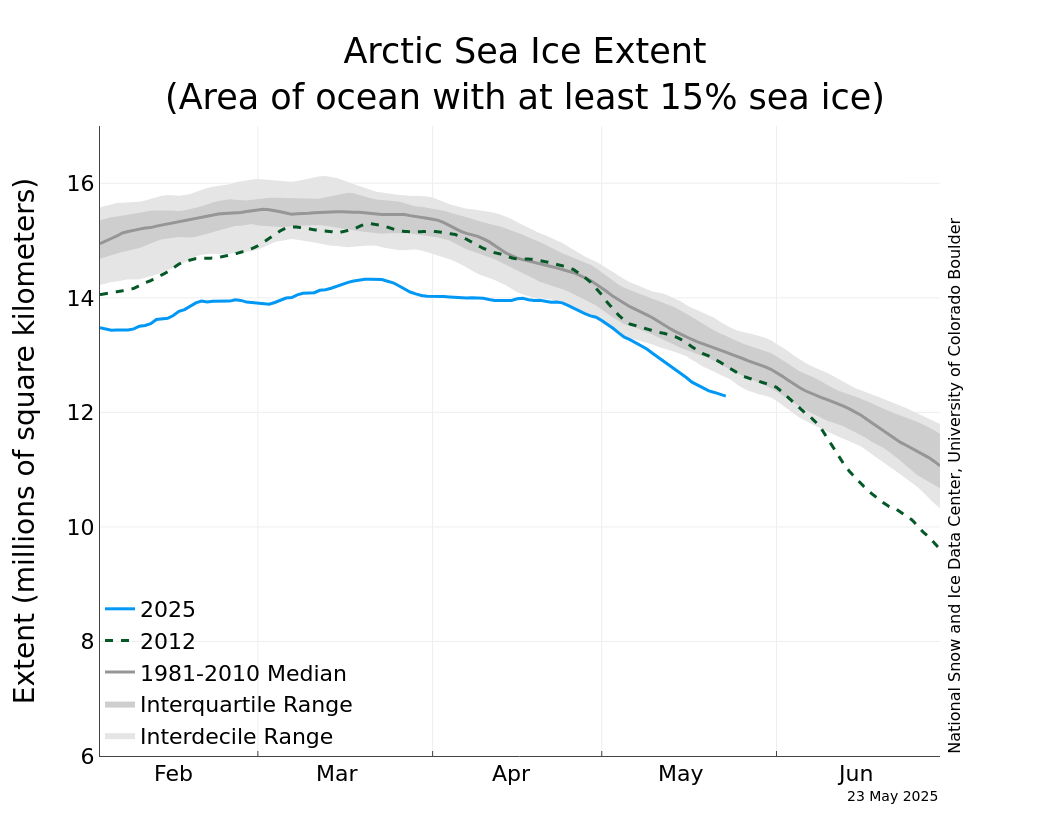
This chart (though it cites the same source) doesn't track the similar chart at the OP link. This chart is much more visible, and DOESN'T say "significantly bigger than usual" -- the blue line in fact is around the bottom 10% of the 30 year period, though rising up -- we'll see where it goes.
The chart in the OP link has so many lines and colors that it is hard to see what it actually says. Clearly this chart (in post 5) doesn't show catastrophe, but neither does it show sea ice above the 30-year average.

