Skip to comments.
COVID Data Tracker Weekly Review for March 4, 2022
CDC ^
| March 4, 2022
| CDC
Posted on 03/04/2022 2:44:41 PM PST by BeauBo
Since the previous week:
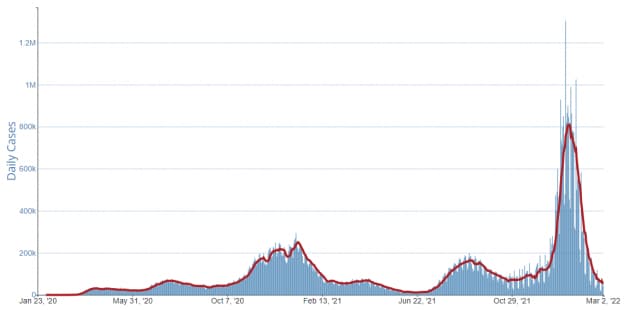
New Cases down 28.5%
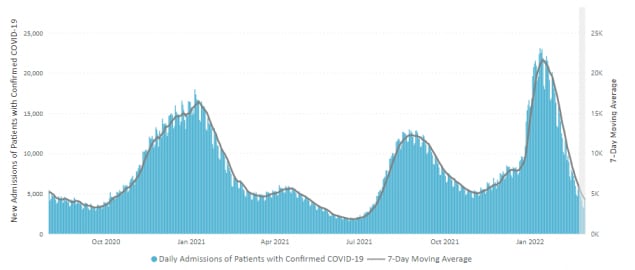
New Hospitalizations down 30.3%
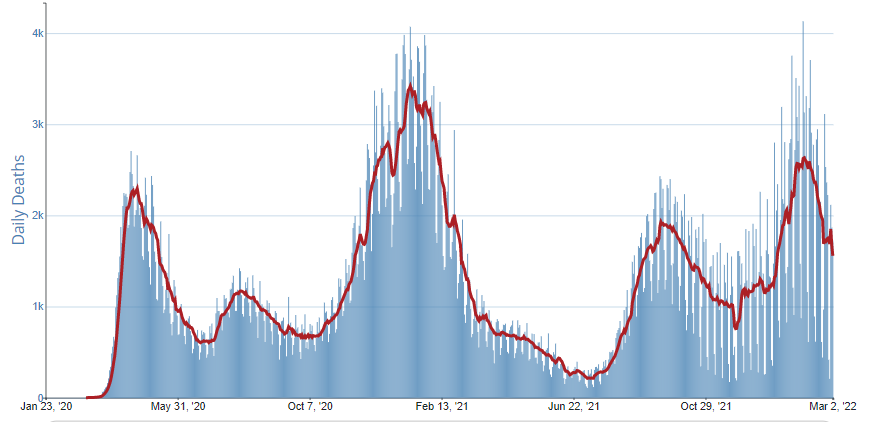
Deaths down 8.9%
Test Positivity Rate was 3.8%
Variants: Omicron is predicted to be around 100% of new cases. Omicron sub-variant BA.2 is projected to be 8.3% of those. BA.2 is now growing its share, of the shrinking number of cases.
Vaccinations: 65.0% of the U.S. population has been fully vaccinated (75.1% of adults). The increase from last week is around 0.1%.
(Excerpt) Read more at cdc.gov ...
TOPICS: Business/Economy; Culture/Society; Government; News/Current Events
KEYWORDS: coronavirus; omicron
Cases numbers continue to drop swiftly, but the rate of decline is slowing slightly as we get to low levels. The seven day moving average number of new cases is now 1/16th of what it was at the peak around January 15th.
Most of the Country is now considered low or medium transmission risk, where masks are no longer recommended. County by County status can be found here: https://www.cdc.gov/coronavirus/2019-ncov/your-health/covid-by-county.html
The BA.2 subvariant of Omicron seems to now be growing its share of the shrinking number of new cases, as it was expected to do (8.3% this week, up from 3.8% last week). BA.2 spreads more than the the original Omicron sub-variant, but otherwise seems to be the same in effect. It is expected to eventually become the dominant strain, but not impact the overall trajectory of the disease significantly - just drag the tail out marginally.
Vaccinations have slowed to their lowest rate since December 2020 (the first month of the program).
New Cases
New Hospitalizations
Deaths
Vaccinations

1
posted on
03/04/2022 2:44:41 PM PST
by
BeauBo
To: BeauBo
What’s their definition of ‘fully vaccinated’ this week?
2
posted on
03/04/2022 3:10:58 PM PST
by
dynachrome
("I will not be reconstructed, and I do not give a damn.")
To: dynachrome
Two (MRNA or Pfizer) or one (J&J/Janssen). Boosters not yet on the list. Hospitals allow medical personnel to be infected, as that means more money via more positive tests for patients. Of course, uninjected negative aren’t allowed, as apparently their attitudes are contagious and put the hospitals at risk for lawsuits if/when legal immunity is breached.
The key numbers are from https://data.cdc.gov/NCHS/Provisional-COVID-19-Death-Counts-in-the-United-St/kn79-hsxy as this gives mortality by county, total mortality and Covid-assigned mortality.
Total mortality was up by 40% in the 18-64 age group in the third quarter (insurance reports). Death for all causes except Covid-assigned were remarkably constant, in a Mendel statistical way (variation by week had p-value of < .001 for lack of variation). Not even seasonal variations were allowed in the non-Covid death attributions. All variations by week 2021-22 were attributed to Covid. This includes diabetes (up 20%), motor vehicle accidents (down 10-15%). All these remarkably balanced out every week to zero +- 1000, when the prior variation was 4000-5000.
Oh, and deaths by injection lot number ranged from zero to 117, and adverse reports from 1 for 60% of lot numbers to more than 1000. Texas had the most deaths in the VAERS database, followed closely by Kentucky. California was 4th or 5th, depending on when you cut off the data.
3
posted on
03/04/2022 3:29:14 PM PST
by
bIlluminati
(Demonetize the Left. Buy nothing from them. Sell nothing to them. Shun them.)
To: bIlluminati
4
posted on
03/04/2022 3:38:46 PM PST
by
dynachrome
("I will not be reconstructed, and I do not give a damn.")
To: BeauBo
You still pushing this LIE called Covid
You MUST be a STUPID Liberal!!!
5
posted on
03/04/2022 3:52:30 PM PST
by
afchief
To: gas_dr; Mom MD; SaxxonWoods; House Atreides; Paul R.; arkfreepdom
All signals good for another week COVID - declining as expected.
6
posted on
03/04/2022 6:35:14 PM PST
by
BeauBo
To: BeauBo
Yes we have 5 total. Had 102 just a few weeks ago
Disclaimer:
Opinions posted on Free Republic are those of the individual
posters and do not necessarily represent the opinion of Free Republic or its
management. All materials posted herein are protected by copyright law and the
exemption for fair use of copyrighted works.
FreeRepublic.com is powered by software copyright 2000-2008 John Robinson