Posted on 01/24/2022 6:17:59 AM PST by janetjanet998
I have now read all of this link, but have not yet started to explore the links contained in the article. I was most struck by the chart copied below:
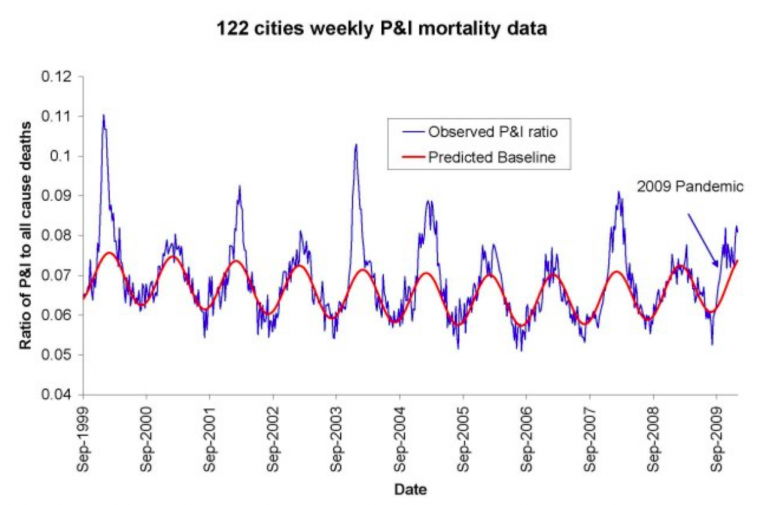
“For example, see Figure 1 of Viboud (2010), which has “Weekly time series of the ratio of deaths from pneumonia and influenza to all deaths, based on the 122 cities surveillance in the US (blue line). The red line represents the expected baseline ratio in the absence of influenza activity,” here:
Graph with peaks and valleys running from Sept. to Sept. over a number of yeaars. If a FReeper can post this graph, it would be helpful. I don’t have that skill level.
The seasonality of the phenomenon was largely not understood until a decade ago. Until recently, it was debated whether the pattern arose primarily because of seasonal change in virulence of the pathogens, or because of seasonal change in susceptibility of the host (such as from dry air causing tissue irritation, or diminished daylight causing vitamin deficiency or hormonal stress). For example, see Dowell (2001).”
Unfortunately the graph part showing the seasonal fluctuation in pneumonia and influenza levels did not copy. However, it clearly shows the lowest level of infection at each year in September. This would indicate that after the six months of highest sun availability, the infection rate is lowest, Thus Vitamin D could be a critical factor quite aside from the proposed humidity level hypothesis. The infection rate begins to drop in late winter as the days get longer. The article mentions that their hypothesis was tested in 122 cities. I would love to see a comparison of high sun high humidity cities with high sun low humidity cities. I may try to do a comparison with such states as shown at Worldometers, Covid-19, US. I also noticed that except for the period after Sept. 2005, there was a peak every other year. I have also noticed that often our weather seems to alternate with Europe every other year. What is the total solar availability each year during the Sept. to April period? There also appeared to be a subtle wave in the botton level over the period shown in this chart. If extended earlier and later, would there be any correlation with sun spot levels? there was at least one reference link to study in Japan where masking has been used for quite some time, especially in cities and their subway systems. I plan to read that one and others.
Meanwhile, I should mention that in addition to taking my supplements, I keep my thermostat at 55, dress warmly, and only warm the few rooms I am relaxing in. The bedroom is not one of them. There I use a heat lamp, blankets, a sweater, and a heating pad. The low thermostat is partly because of limited retirement income to heat a large house. Nice to know I am also protecting my lungs from low humidity.
The seasonality of the phenomenon was largely not understood until a decade ago. Until recently, it was debated whether the pattern arose primarily because of seasonal change in virulence of the pathogens, or because of seasonal change in susceptibility of the host (such as from dry air causing tissue irritation, or diminished daylight causing vitamin deficiency or hormonal stress). For example, see Dowell (2001).
https://www.uchicagomedicine.org/forefront/coronavirus-disease-covid-19/vitamin-d-covid-study This link leads to a retrospective and a future study on the favorable effect of higher levels of Vitamin D on various health aspects. Some time ago I read a study showing that Covid hospitalized black men were 80% deficient in Vitamin D, but a control study to check for the poverty influence on health showed that homeless people had a low level of Covid.
Thanks! :-)
Disclaimer: Opinions posted on Free Republic are those of the individual posters and do not necessarily represent the opinion of Free Republic or its management. All materials posted herein are protected by copyright law and the exemption for fair use of copyrighted works.