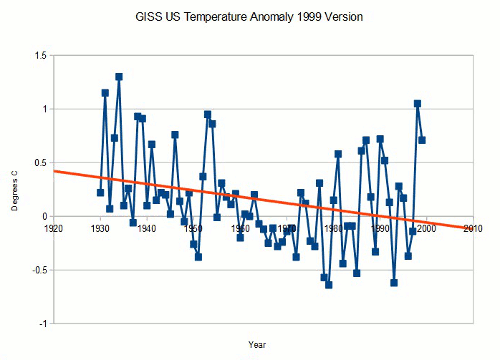
Especially when the 1930s are retroactively reduced in temperature. Someone posted graphs of official temperature records taken at various times and showed the 1930s being "corrected" to be able to draw a line of increasing temperatures through the graph.
I will look for it and post it if I can find it.