To: RetiredScientist
Are they also tracking cases and deaths from the regular flu? Wonder how they compare to prior years and to the Covid-19?
69 posted on
04/05/2020 1:03:32 PM PDT by
Jim Robinson
(Resistance to tyrants is obedience to God!)
To: Jim Robinson
Hi Jim. I checked the NY Times github repository. I looked at what they had and did not see Flu.
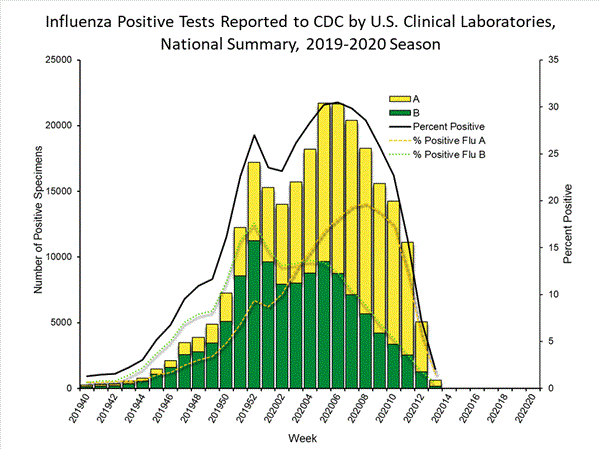
That said, the CDC is tracking Flu for this season. Flu is a bit more complicated because they are tracking two strains, "A" and "B". The data file is an html page and needs to be screen-scraped. They are also plotting cases not total cases like COVID-19. That said, there is a nice graphic CDC Weekly Flu Plot here.
I'll see what I can do with the data and try to generate something with total cases. The weekly dates are an odd format so need to be converted. It needs some data "cleaning" to compare to the COVID-19. That is the annoying part of data analysis. If I get something useful, I'll post it.
To: Jim Robinson
An update: I converted the dates for the CDC Flu study to standard dates for the start of the week for the data. The bad news is that the data only includes the Fall flu season (from 2019-09-30 to 2020-03-23) when the fall season ended. Still, it will be interesting to see the shape of the curve to that of COVID-19. I'll keep you updated...
To: Jim Robinson
Jim, I got the Flu data from the CDC from the Fall 2019-Winter 2020 flu season. They track two strains:
TypeA displayed as a blue line and
Type-B displayed as a red line and plotted the cumulative cases.

FreeRepublic.com is powered by software copyright 2000-2008 John Robinson