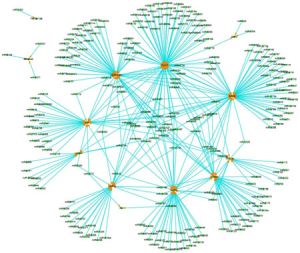
Figure 3: A small portion of the microRNA regulatory network serves as an excellent example of the second dimension of the genome. Here, the orange areas represent 13 genes that are upregulated in association with atherosclerosis by 262 miRNAs (green dots with labels) that are, in turn, produced in other parts of the genome. (after Lin et al. 20143)
Clickable Link
Splice -— soon to come in real life....