To: expat_panama
Just wondering, what does this mean?
“Someone tell me they see something different but imho we’re getting lots of signs of a typical index top.”
Is it time to buy energy stocks, or are things going to go lower still?
To: Abigail Adams
what does this mean? “Someone tell me they see something different but imho we’re getting lots of signs of a typical index top.”Yeah, that really can be taken a lot of ways. I was thinking about stock indexes, like the Standard&Poors500 or the NASDAQ and how for a while now we've been seeing a repeating pattern:
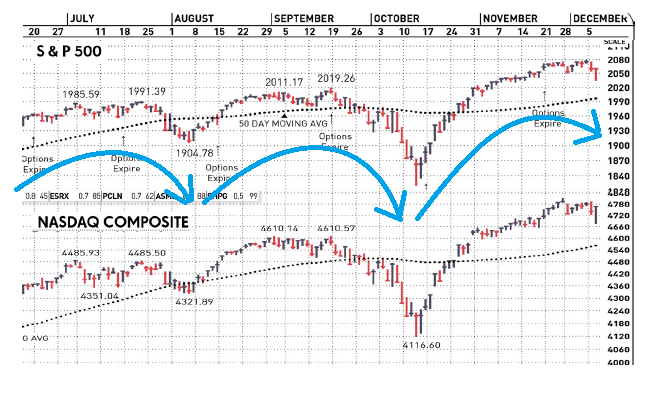
So since every 3 months or so we get that umbrella shaped bounce like, my thinking is that we were looking at just one more in a long series of market tops before the next plunge. The danger is that the human eye can often see patterns even when they're not there, so that's why I was wondering if anyone else was seeing this or was it just me.
To: Abigail Adams
Is it time to buy energy stocks, or are things going to go lower still? This week I have been buying BP. The lower price makes the dividend yield very attractive. That said, I am fully capable of, and have the history to prove, buying too high, and selling too low. IOW, I cannot pick the exact top or bottom.
32 posted on
12/10/2014 10:09:00 AM PST by
abb
("News reporting is too important to be left to the journalists." Walter Abbott (1950 -))
FreeRepublic.com is powered by software copyright 2000-2008 John Robinson