Free Republic
Browse · Search
News/Activism
Topics · Post Article

To: Foundahardheadedwoman
Here's a sunspot chart showing the various peaks and dips throughout the past centuries. Note the "Medieval Max". It corresponds to the "Medieval Warm Period". The "Maunder Minimum" corresponds to the "Little Ice Age", and the "Modern Max" to the recent warming trend we had been experiencing, at least until the past 15 years or so.

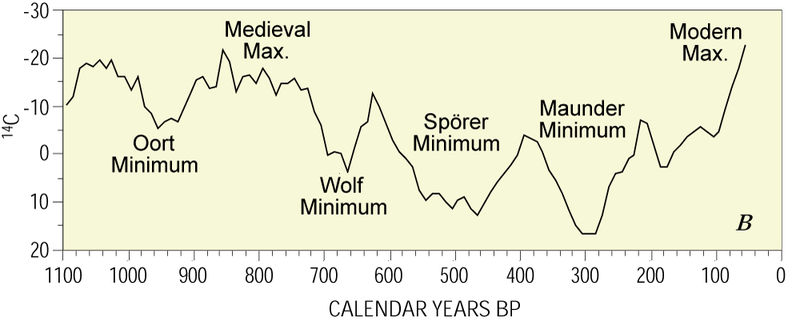
"Changes in carbon-14 concentration in the Earth's atmosphere, which serves as a long term proxy of solar activity. Note the present day is on the left-hand side of this figure."--wikipedia

3 posted on 08/04/2014 8:33:43 AM PDT by ETL 2
[ Post Reply | Private Reply | To 1 | View Replies ]


To: ETL 2

” Note the present day is on the left-hand side of this figure.”

WELLLLLLLLLLLLL.......... it is not. It is on the right hand side of this figure.

Or were you just trying to point out their error ?


7 posted on 08/04/2014 8:58:53 AM PDT by UCANSEE2 (Lost my tagline on Flight MH370. Sorry for the inconvenience.)
[ Post Reply | Private Reply | To 3 | View Replies ]

Free Republic
Browse · Search
News/Activism
Topics · Post Article


FreeRepublic, LLC, PO BOX 9771, FRESNO, CA 93794
FreeRepublic.com is powered by software copyright 2000-2008 John Robinson