Here are the breakdowns by age:


Here are the breakdowns by gender:


RE; The Chart of Civilian Labor Force Participation Rate.
What factor accounts for most of the drop?
Retirements (i.e., aging labor force ) or simple discouragement (i.e. inability to find a job )?
Of course, it would be helpful if there were another chart showing the increase/decrease of the AGE GROUP dropping out.
Here are the breakdowns by age:
Here are the breakdowns by gender:
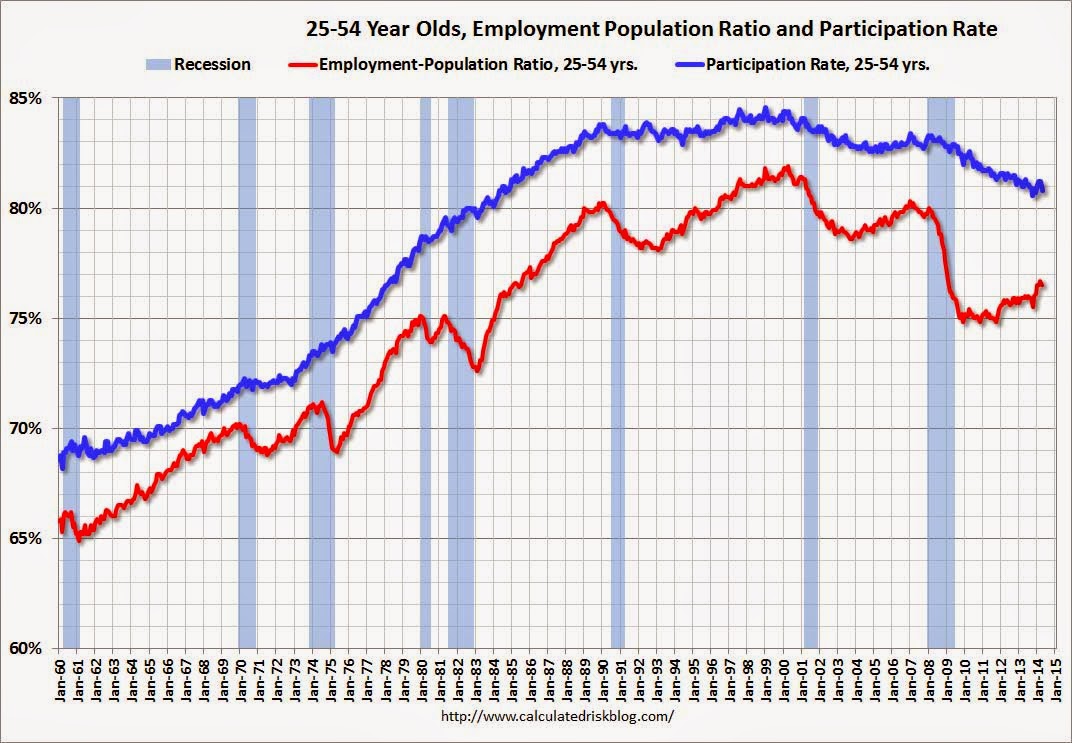
Employment-Population Ratio, 25 to 54 years old
Employment Population Ratio, 25 to 54Since the overall participation rate declined recently due to cyclical (recession) and demographic (aging population, younger people staying in school) reasons, an important graph is the employment-population ratio for the key working age group: 25 to 54 years old.
In the earlier period the employment-population ratio for this group was trending up as women joined the labor force. The ratio has been mostly moving sideways since the early '90s, with ups and downs related to the business cycle.
The 25 to 54 participation rate declined in April to 80.8% from 81.2% in March, and the 25 to 54 employment population ratio decreased to 76.5% from 76.7%. As the recovery continues, I expect the participation rate for this group to increase.
Read more at http://www.calculatedriskblog.com/2014/05/comments-on-employment-report.html#rymCZVJhceGum8Tc.99