
Posted on 10/25/2013 10:44:37 AM PDT by Kaslin
Here are a few demographic-related charts of the workforce, civilian non-institutional population, and jobs, by age-group, from reader Tim Wallace.
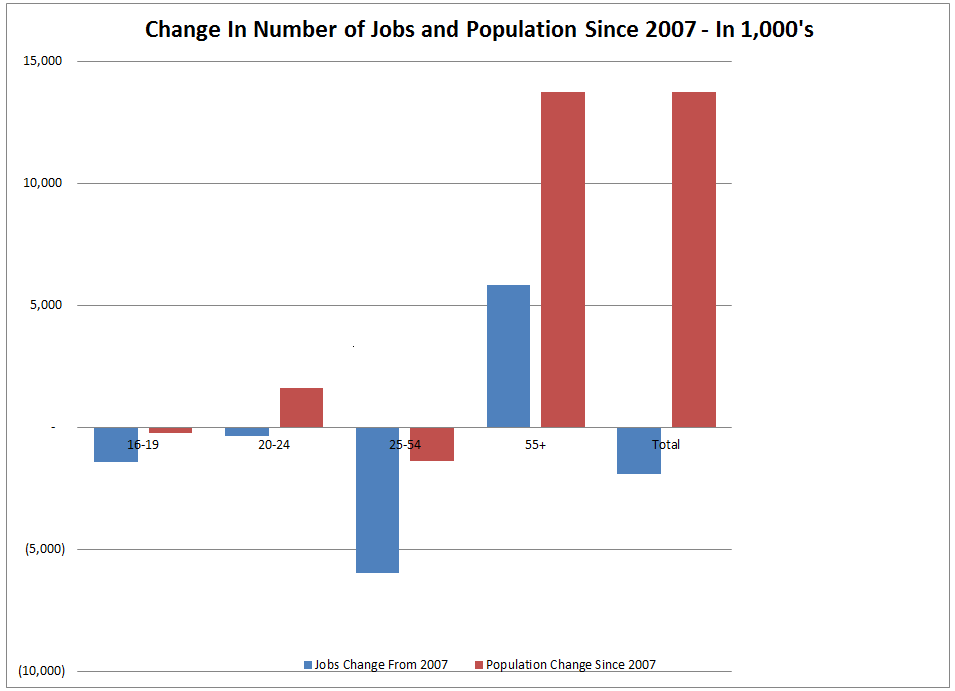
Change in the Number of Jobs Since 2007
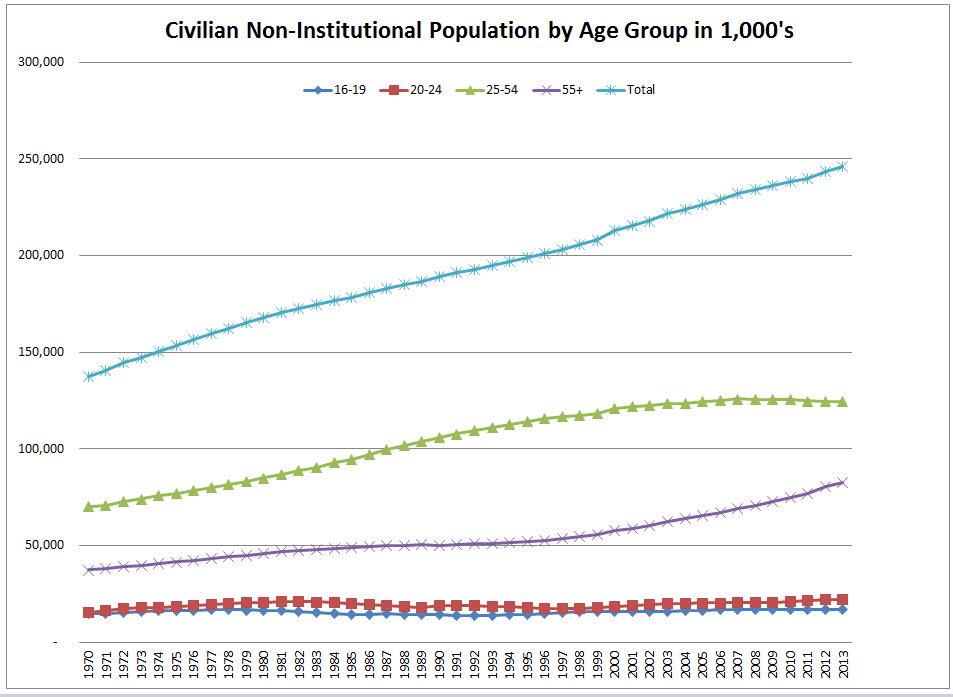
Civilian Non-Institution Population Since 1970
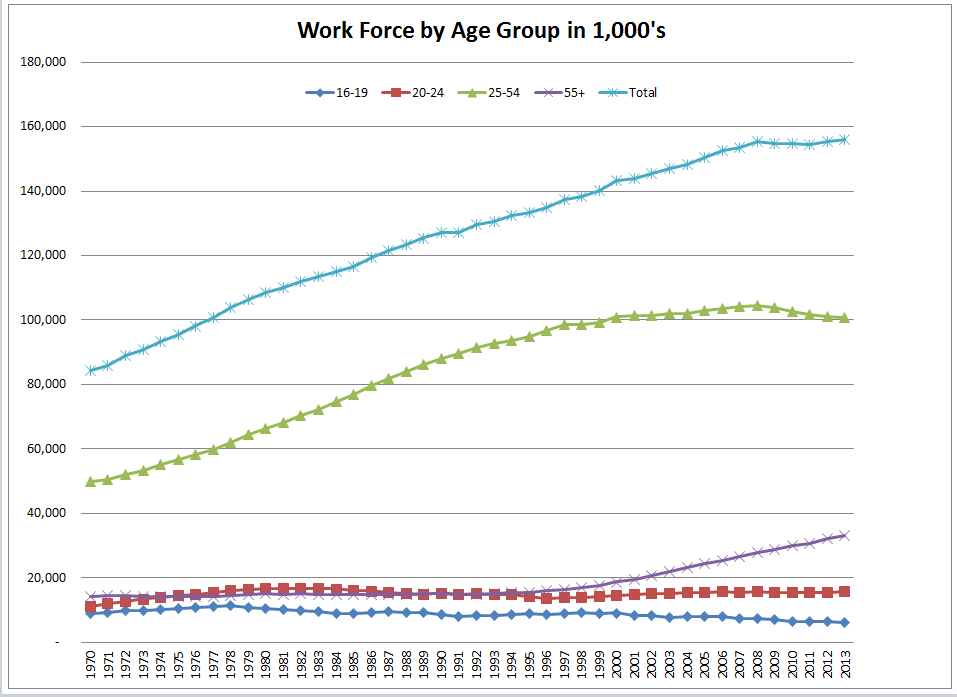
Workforce Since 1970
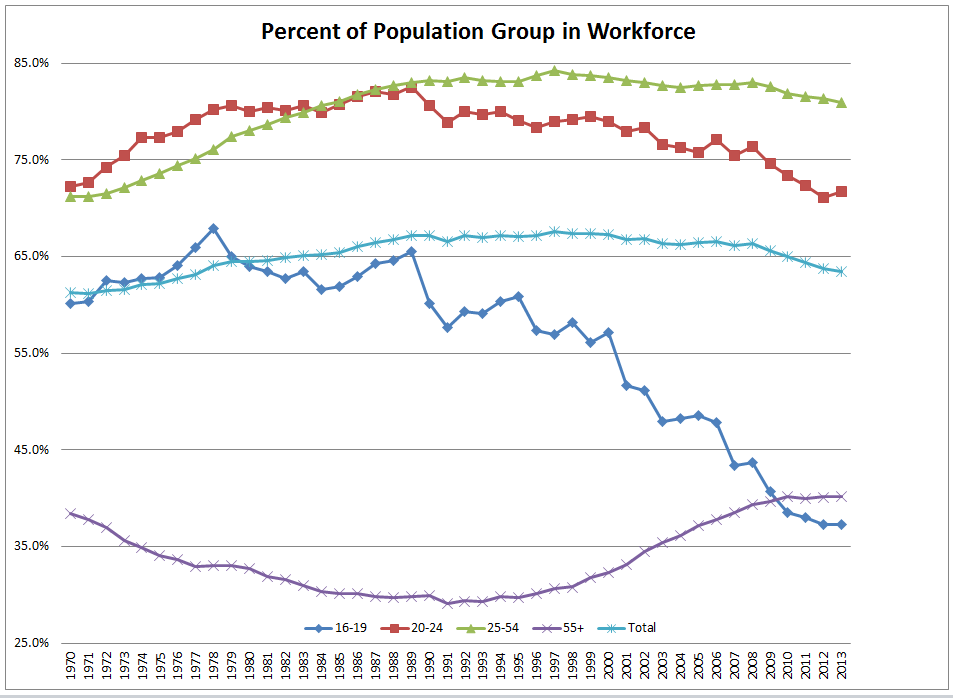
Percent of Population in Workforce Since 1970
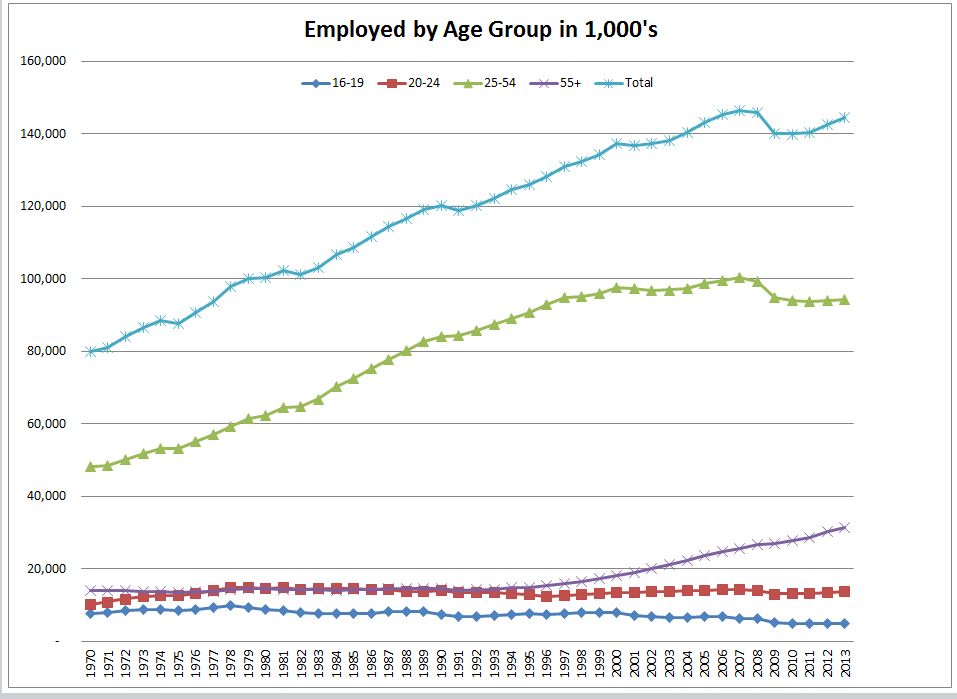
Number in Age Group Employed
Percent of Age Group Employed Since 1970

Wallace writes ...
Mish,
The attached charts are eye openers.
Graph 1 Comments
The first chart shows the change in the number of jobs and the population since 2007. It shows us that in the 16-19 age group the population has shrunk by 239,000, while the number of jobs in this age group has shrunk by 1,415,000! In the 20-24 age group the population has grown by 1,625,000 while the number of jobs has shrunk by 362,000. For the under 25 age group we have 1,777,000 less jobs with 1,386,000 more people.
In the 25-54 age group that everyone always focuses on, we see a loss in population of 1,382,000 people since August of 2007, but an even greater loss in jobs - 5,940,000! Add to this the loss of 1,777,000 up above and we see the 16-54 age groups have lost 7,717,000 jobs since 2007. And, the population has basically been flat.
Since 2007 we have added 13,745,000 people to the population over age 55. We have also added 5,820,000 to the number employed in that age bracket.
Jobs were lost in every age bracket except the 55+, with 16-19 dropping 22.6%, 20-24 falling 2.6%, 25-54 going down 5.9% and 55+ going UP 22.7%!
Graph 2 Comments
The second graph shows the Civilian Non-Institutional Population by age - note the basic flat lines on all but 55+. The graph shows the Work Force by age - note once again only 55+ goes up.
Graph 4 comments
The fourth graph shows the number employed by age group. Note that only the 55+ group benefited in the current "Recovery". The other groups are all down from 2007, with 16-19 devastated. Just go in Walmart and McDonald's and you will see it first hand - senior citizen workers abound.
Graph 5 comments
The fifth graph shows the percentage of an age group that is employed. The percentage plunged in every age group except 55+.
Graph Six Comments
The last graph shows the percentage of the age group employed. It follows the exact trend of the fifth, as it must.
Those in sales and marketing you should focus on the 55+ age group. Forget the teenagers, they are contributing little, and their parents are sliding fast! Those in the 20-24 hope the 55+ start to retire, but in increasing percentages, they choose not to
Very interesting data, thanks to the BLS for giving us access to the ranges in the data base.
As usual, all data not adjusted for seasonality, just direct comparisons of actual data year on year.
Tim
The charts show something I have repeatedly said since 2008: "kids will be competing with their parents and grandparents for jobs that do not pay a living wage."
Folks in the 55+ age group who in normal times might be retiring see nothing but uncertainty in the future, and if they have good jobs, are holding on to them if they can for fear they won’t get hired again if they retire and then everything goes to hell.
And the youngest members in the workforce end up paying the freight on those decisions. The fact that they are also the biggest Obozo supporters only accentuates the irony.
Hope and Change everywhere you look.../s
And the youngest members in the workforce end up paying the freight on those decisions. The fact that they are also the biggest Obozo supporters only accentuates the irony.
Imagine by the time they figure it out they’ll be enslaved head to toe kicking themselves in the a$$ every singe day for being big dummies ( and probably fined if they speak out about it)
Speaking of the changing workforce, check out the sign on the wall in the photograph.
Looks like it’s written in Spanish!
Disclaimer: Opinions posted on Free Republic are those of the individual posters and do not necessarily represent the opinion of Free Republic or its management. All materials posted herein are protected by copyright law and the exemption for fair use of copyrighted works.