Posted on 05/04/2012 5:35:50 AM PDT by Kaslin
Previously, we advanced two possible hypotheses that might explain what is currently happening with the number of seasonally-adjusted initial unemployment insurance claim applications being filed in the U.S. each week:
In that post, we indicated that we might not know which hypothesis was correct until sometime this summer. But that was before the U.S. Bureau of Labor Statistics released its initial estimate of the number of new jobless benefit claim filings on Thursday, 26 April 2012. Now, it is very possible we might know the answer as early as this upcoming Thursday, 3 May 2012.
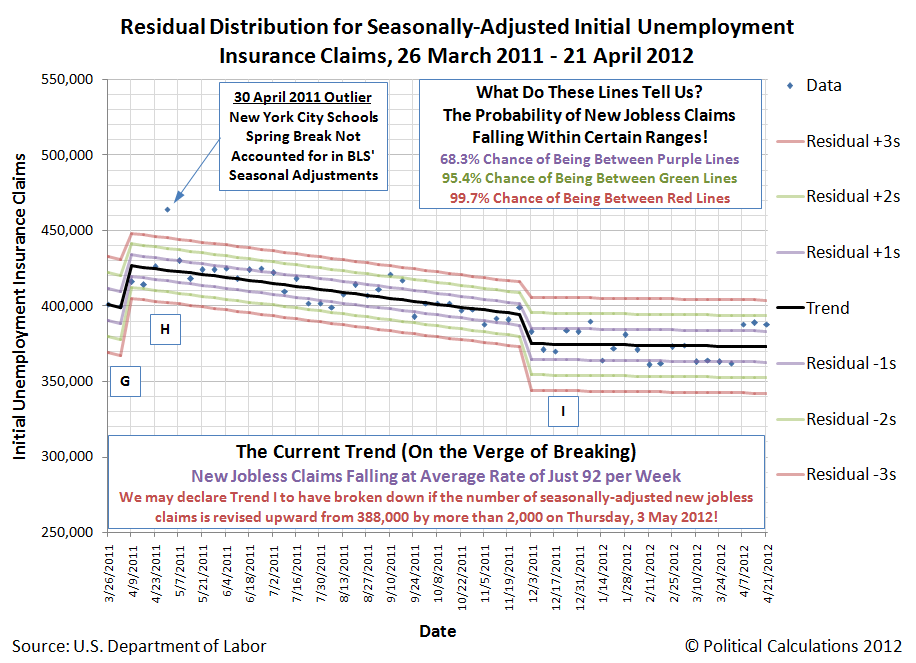
We've updated both charts showing our two hypotheses to incorporate the data as it stands as of the BLS' 26 April 2012 report. The first chart illustrates our first hypothesis:
In this chart, we would seem to be realizing our first hypothesis, in that the indicated trend, which we've identified as Trend I, is in the process of flatlining.
 Now take a closer look. Focusing in on the data from 4 February 2012 through 31 March 2012, we see that the mean trend line for all data reported since 3 December 2011 has shifted in the past week so that all but one of these data points are below the line.
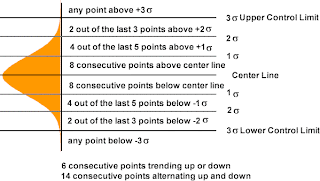
Following the well-established rules developed by Western Electric over half a century ago to determine whether or not an existing trend has broken down after having been in statistical equilibrium, which are visually depicted in the bell-curve image (it's not there for decoration!), we find that all it would take for us to declare this hypothesis to be false is for the most recent data, for the week ending 21 April 2012, to be revised upward by more that 2,000 claims, as the resulting change in the mean trend line will place the data for these nine consecutive weeks below it.
If the BLS keeps to its recent track record, it will definitely be revising the number of new jobless claims recorded for the week ending 21 April 2012 upward when it revises its data for that week this Thursday, 3 May 2012 - the only question is by how much.
Our second chart shows what the new trend would look like at this point in time:
This Thursday, our two hypotheses regarding the current trend in new jobless benefit claim filings will enter the theoretical Thunderdome, and very possibly, only one will leave. Stay tuned!
I don't hang out here much. I hang out on economic forums. Whoopsie! Your bad.
I've seen your agenda here on FR. FR is not really a good place for economic stuff, and we both know it. I was just firing a warning shot across the bow of your strawman.
Jonah Goldberg is a tool. He dropped the ball on Derbyshire - a major sign of a weak mind, too influenced by the Beltway twaddle.
So, if I am engaged in BS (with an alleged hidden agenda), you should have no trouble demonstrating it. Otherwise, you are just talking out of your behind.
http://www.freerepublic.com/tag/by:1rudeboy/index?tab=comments;brevity=full;options=no-change
It’s amazing. You print the actual facts from the actual source and certain morons still deny reality.
I never called you a moron, Toddster, but have it your way...
rude & Toddy, the economic blowhard twins. :-)
Joe,
You are at least partially right.
To be counted as “unemployed,” a person must be actively searching for work.
By definition, people drawing Unemployment Benefits must look for work, and, by definition, are unemployed.
Once their UI Benefits are exhausted, however, some people - but not all people - end their job search and drop out of the workforce.
Those people are NOT counted as unemployed.
You’re batting 0 for 2.
Watch out for those facts, you might be allergic.
As a practical question, how does the government count the people who are not receiving unemployment benefits? There are no people getting a check, so how do they keep track of people no longer in the system?
**snicker**
Still the same smarmy dweeb you always were, eh, Toddy?
Bucking for another 4 month layoff? You just can't keep yourself from trolling, can you?
Don't worry, Toddy & rude will show up in a while to tell me I'm stupid...
The same way they track people every month to calculate the unemployment rate. Pretty sure there's link upthread.
Hey, you got one right.
Did someone hack your account?
8.1% of what?
So they 'estimate' by talking to 60,000 out of 200,000,000 or so. Yea, that's scientific. In other words it's a f****** guess at best at complete bull**** at worst. Toss the fact that this administration lies as easily as I breathe and I'm taking the latter.
President Obama, Democrats and Unions would be able to take so much more if they could convince the environmentalists gas under $3.00 would help them all.
So why don't you have a nice cup of STFU? ;-)
They could talk to 200,000,000. Is that your suggestion?
Does this mean you won’t defend Williams? LOL!
Does this mean you’re still drinking and trolling? LOL!
I didn’t make a suggestion. I called “bullshit” on their “estimated” numbers.
Which households are they calling? When are they calling them? Where are these households located? What exactly are these households being asked? Who’s doing the answering? What biases are inserted by those doing estimating?
Until you know the answers to these questions you’re talking out off your ass.
I’m still pointing out idiocy.
Disclaimer: Opinions posted on Free Republic are those of the individual posters and do not necessarily represent the opinion of Free Republic or its management. All materials posted herein are protected by copyright law and the exemption for fair use of copyrighted works.