To: FromTheSidelines
Okay, we’ve been over this before. I just don’t think you want to listen.
Fiscal Year 2009 started in October of 2008. Bush signed a CR lasting until March 6th of 2009. TARP was requested and signed by Bush in October of 2008 and applied to FY09. Obama was inaugurated in January of 2009. Obama then signed a CR/budget taking us to the end of the fiscal year, i.e. September of 2009. The Obama stimulus applied to FY09 also. I think most intelligent people are about to figure out who did what and when. If they don’t already know, they can look it up.
There is nothing in error on the chart. I’m sorry it doesn’t say what you want it to say.
Two heads are better than one but there has to be some sort of conversation for that to be true. You’re not really saying anything other than “I don’t like it.” If you can point to some primary source that would add information to the discussion, I’m all eyes.
To: MontaniSemperLiberi
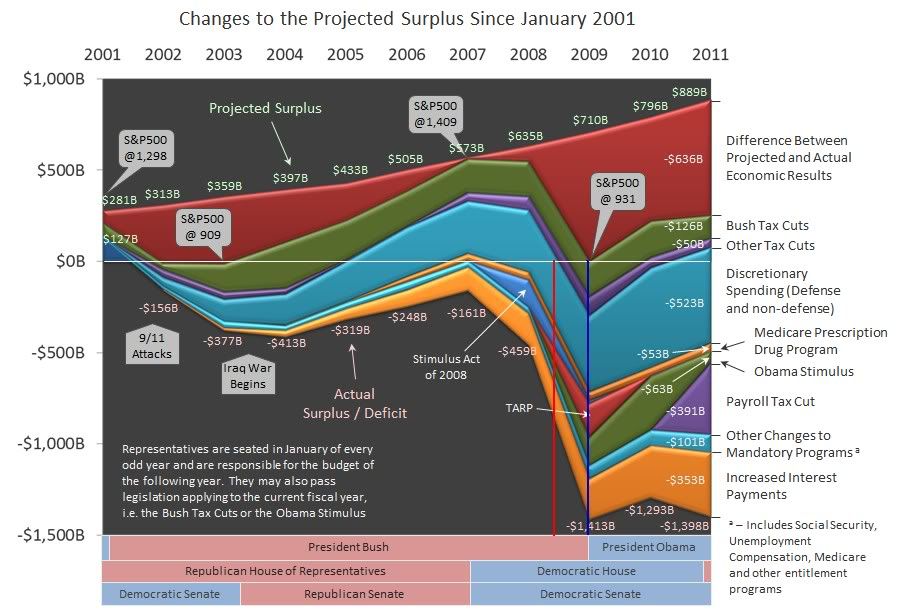
The blue line is what you claim is "right"; it's actually the red line. Why you want to excuse President Obama for $1 trillion in additional debt is beyond me, but you go ahead and be a tool of the MSM and the Democrats, you keep giving validation to the "BUSH'S FAULT!" meme...
142 posted on
09/05/2011 2:25:14 PM PDT by
FromTheSidelines
("everything that deceives, also enchants" - Plato)
To: MontaniSemperLiberi
Additionally, that graph assumes that the Bush tax cuts were only negative, that they could only drag down the deficit, not reduce it. The facts are - broad cuts in income tax rates tend to accelerate the GDP growth and more than compensate for themselves in total revenue growth.
One needs look no further than the massive increases in Federal revenue after the Bush tax cuts to see that they were - in fact - the Bush tax increases! The tax rates were cut, but the total tax dollars collected were increased (because of the massive growth in GDP). Tax rate cut, total tax increase.
But your graph doesn’t show that - it just looks at the “negative” part of the Bush tax cuts and ignores the gains made from those cuts. Your graph feeds right into the Democrats mantra of “tax cuts for the rich” as harmful to the overall economy and a cause of our deficit.
Want me to continue?
143 posted on
09/05/2011 2:39:52 PM PDT by
FromTheSidelines
("everything that deceives, also enchants" - Plato)
FreeRepublic.com is powered by software copyright 2000-2008 John Robinson