Following is what the article said:
Over the past 50 years, tax revenues have deviated little from their 18% of gross domestic product (GDP) average.
This is why I always attempt to check sources and not accept anyone's interpretation of them. The article said "deviated little" and you interpreted this to be the same as "very, very close". More important, however, is the fact that "deviated little" is a highly questionable interpretation of the data. The following graph shows total tax revenues and total individual income tax revenue from 1980 to 2005.
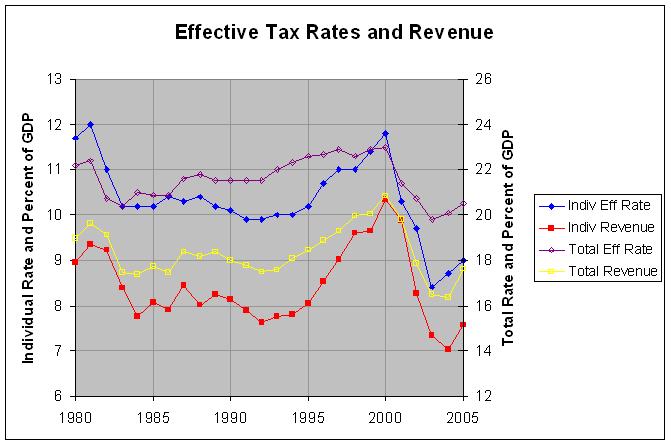
The actual numbers and sources for this graph can be found at this link. As can be seen, total revenue varied from 16.35% of GDP to 20.86% of GDP and revenue from individual income taxes varied from 7.03% of GDP to 10.34% of GDP during that period. I don't know how one can call these deviations "little". In any case, the graph shows that there was a relatively close correlation between these two revenue levels and the corresponding effective tax rates that generate them. I explain all of this in much more detail at this link.
I try to fact-check all claims that I hear in the political arena but I pay especially close attention to these "amazing facts" that both sides occasionally come up with. A careful analysis of the data almost always show these to be a simple sleights of hand, so to speak. The actual facts usually turn out to be much closer to what one would expect them to be.