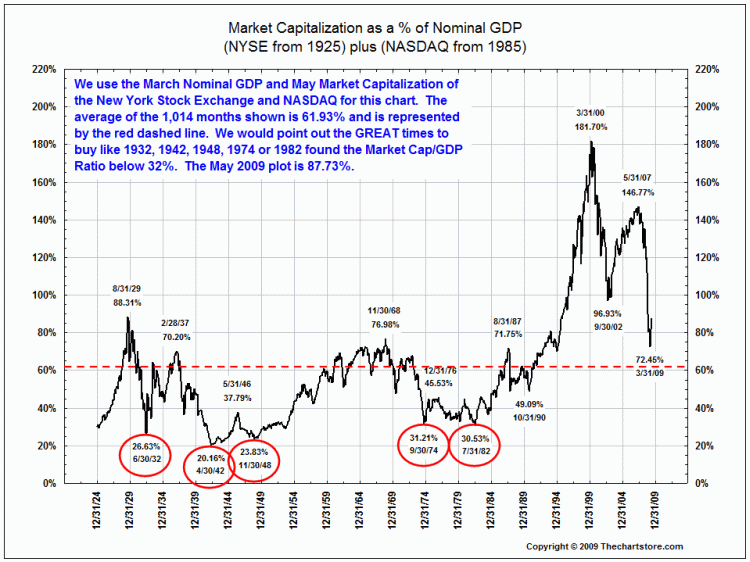
“Stock Market Capitalization To GDP Ratio
http://www.investopedia.com/terms/m/marketcapgdp.asp
A ratio used to determine whether an overall market is undervalued or overvalued.
Typically, a result of greater than 100% is said to show that the market is overvalued, while a value of around 50%, which is near the historical average for the U.S. market, is said to show undervaluation.”
Very interesting. Theoretically, the value should be around 100%, not 50%. That says that historically, the stock market has been under invested.
You could make an argument the value should be somewhat higher than 100%, since market price is determined by past performance plus future expectations. In a rising market, it should be higher than 100%, and in a falling market, lower than 100%. With a historically expanding economy, the value should be at or above 100%.
Do you have a chart of this ratio over the years?

What's the theory here? Could you expand?