Well you’ve sharpened a little but not much.
You first started with $100 then $200 and who knows what in your post# 256. Your data now includes part-time wage earners such as students on summer break. They will not be receiving a rebate as they are dependents.
Note that current federal minimum wage is $6.55 which translates in a full-time work to 13,100 a year which is above the poverty line. Won’t be any free rebate money for full-time minimum wage earners.
Therefore your census data not only includes students part-time employees, or holiday help but also disabled and the unemployed. In such cases there will be insurance payments of partial disability or of social security or SSI, and also state insurance programs. Whatever the source, the money that ends up in the hands of a low-income person will be with high probability completely spent.
And don’t start diverting attention to other ‘socialist’ programs supplementing these low-income earners that I have alluded to. Insurance is insurance and pensions are pensions. If a retired worker wants to work part-time and also has a pension, I am not going to get into thickets of how they are receiving that money.
So your numbers of people falling in the low income categories may indeed be dependents or have supplemental non-earned income.
That said, let’s see what the maximum impact would be assuming unrealistically that all of these people are going to be taking the rebate and not paying it all back by spending too little for whatever reason.
After totalling up the number of wage earners you refer to, the number is about 12 million. If all 12 million receive a rebate of $196 in a month and that on average $100 is pocketed as profit after spending ‘too little’, the that’s 12 million x $100 = $1.2 billion per month or $14.4 billion per year.
So we will say for the purpose of this argument that $14.4 billion of rebate money falls into the hands of peopole that have not paid it back in NRST taxes.
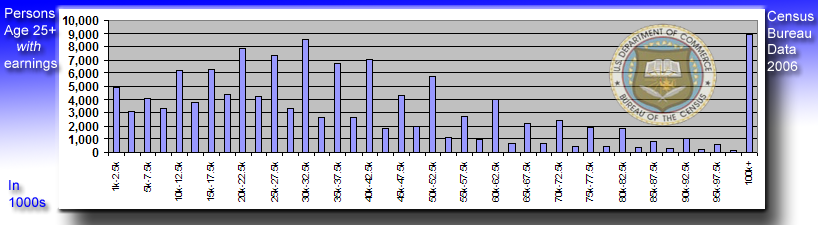
Next look at the total earnings in your graph:
http://upload.wikimedia.org/wikipedia/commons/9/98/Personal_Income_Age25.png
Not counting the lower three bars, the total add up to about $5.1 trillion in earnings per year.
So the $14.4 billion paid out in freebies is about 3 1000th’s of a percent (.003) redistributed from the upper earners to the first three bars on your graph.
That is no where near a ‘massive’ wealth redistribution system.
This proves you have been barking about nothing.