You missed the point here. What Happer says is: "We have been in a period of global warming over the past 200 years, but there have been several periods, like the last ten years, when the warming has ceased," The point of the graphic is that judging global warming based on variability of temperatures over a decade is pointless. The 1980s are warmer than the 1970s, the 1990s are warmer than the 1980s, and this decade is warmer than the 1990s. That's what the graphic clearly shows. Global warming is a signal within the noise of interannual variability. The signal emerges on decadal time-scales, not annual. A further way to show this:

or this
 In summary, to say that warming has "ceased' when looking at only 10 years of data is obviously fallacious. But because the current ten-year trend is flat, it's a popular thing for skeptics to do.
CO2 in the atmosphere continues to absorb heat as concentration increases because the atmosphere is three-dimensional, and heat will continue to be absorbed in upper layers of the troposphere.
Not true... but this isn't about water vapor. First of all, it's about CO2. I have to wonder, where do you get 0.25 C for direct forcing of temperature for CO2 doubling? The atmospheric models put it at 0.8-0.9 C; I can track that down if necessary. But back to CO2. From the second link about this ("What Angstrom didn't know")
"The absorption factor, so defined, is given in the following figure, based on the thousands of measurements in the HITRAN spectroscopic archive. The "fuzz" on this graph is because the absorption actually takes the form of thousands of closely spaced partially overlapping spikes. If one were to zoom in on a very small portion of the wavelength axis, one would see the fuzz resolve into discrete spikes, like the pickets on a fence. At the coarse resolution of the graph, one only sees a dark band marking out the maximum and minimum values swept out by the spike. These absorption results were computed for typical laboratory conditions, at sea level pressure and a temperature of 20 Celsius. At lower pressures, the peaks of the spikes get higher and the valleys between them get deeper, leading to a broader "fuzzy band" on absorption curves like that shown below."
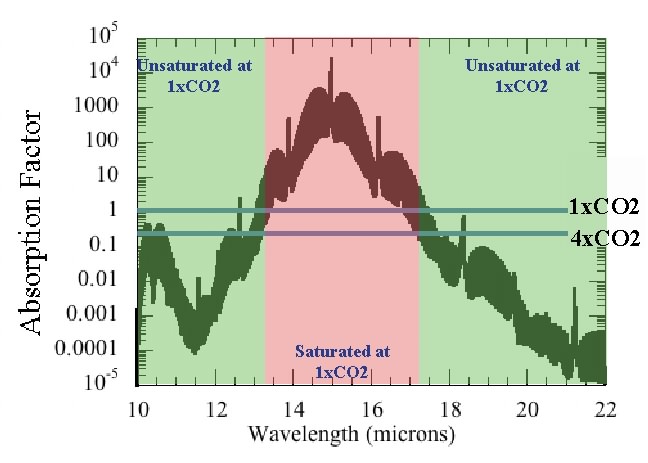
"We see that for the pre-industrial CO2 concentration, it is only the wavelength range between about 13.5 and 17 microns (millionths of a meter) that can be considered to be saturated. Within this range, it is indeed true that adding more CO2 would not significantly increase the amount of absorption. All the red M&M's are already eaten. But waiting in the wings, outside this wavelength region, there's more goodies to be had. In fact, noting that the graph is on a logarithmic axis, the atmosphere still wouldn't be saturated even if we increased the CO2 to ten thousand times the present level. What happens to the absorption if we quadruple the amount of CO2? That story is told in the next graph:"
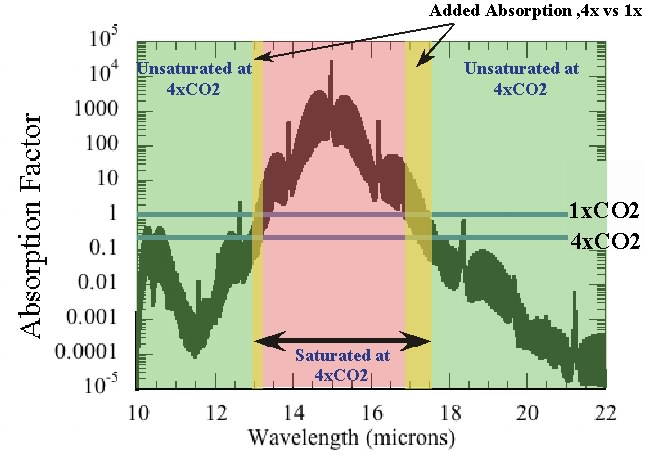
"The horizontal blue lines give the threshold CO2 needed to make the atmosphere optically thick at 1x the preindustrial CO2 level and 4x that level. Quadrupling the CO2 makes the portions of the spectrum in the yellow bands optically thick, essentially adding new absorption there and reducing the transmission of infrared through the layer. One can relate this increase in the width of the optically thick region to the "thinning and cooling" argument determining infrared loss to space as follows. Roughly speaking, in the part of the spectrum where the atmosphere is optically thick, the radiation to space occurs at the temperature of the high, cold parts of the atmosphere. That's practically zero compared to the radiation flux at temperatures comparable to the surface temperature; in the part of the spectrum which is optically thin, the planet radiates at near the surface temperature. Increasing CO2 then increases the width of the spectral region where the atmosphere is optically thick, which replaces more of the high-intensity surface radiation with low-intensity upper-atmosphere radiation, and thus reduces the rate of radiation loss to space."
Now, getting back to that point about 0.25 C with doubling, even Happer himself said: "There is little argument in the scientific community that a direct effect of doubling the CO2 concentration will be a small increase of the earth’s temperature — on the order of one degree.". Which agrees with what I've read (and which I can dig up if you need me to). So I've got no clue why you're stating something in opposition to even what the chosen skeptic here says.
Moving on:
Point 3, about water vapor feedback. Dessler in 2008 at least acknowledges the variation in UT RH (I don't have the paper, just your abstract), but it is quite incorrect to use any kind of constant UT RH comparison. Dessler's abstract just says that it's "similar" to the atmosphere maintaining constant RH. AIRS data provides their result, and Remote Sensing Systems gets a measured positive water vapor increase with increasing atmospheric temperature from MSU. So it's futile to refute the point, IMO. You're the weather expert, keep on disputing it if you feel it necessary.
Point 4, attribution studies: The disconnection in the water bucket SST measurements explained a glitch, not the overall cooler temperatures of the 60s and 70s. That's still mainly attributed to anthropogenic SO2, maybe with a kick from volcano Agung 1963. Your assertion that the models are tweaked has to be supported. Critique the following if possible: Ensemble Climate Simulations With Anthropogenic and Natural Forcings. This is similar to what the IPCC says, though I don't know if this specific study is cited in the Fourth Assessment Report.
Unfortunately you will never get anywhere with the hockey stick. The problems were explained here in 2005: http://www.uoguelph.ca/~rmckitri/research/McKitrick-hockeystick.pdf The two major problems are decentering (scaling based on variance in the 20th century portion of the data) and autocorrelation. The first problem is shown in figure 5, the second in figure 7.
I wasn't attempting to validate the hockey stick; I was merely pointing out that the MWP wasn't removed. What Happer doesn't mention and what the reexaminations of the hockey stick concluded was (at the time) that nothing quantitatively reliable could be said about temperatures more than 400 years ago. So when talking about the MWP, how can Happer happily conclude "there really was a medieval warm period that was as warm or warmer than today"? What anecdotal qualitative evidence is he basing that statement on? And if it's qualitative, it could have been cooler than, as warm as, or warmer than today. He can't make a definitive statement, yet he does anyway.
There's new studies out there, by the way. Some very interesting stuff from freshwater phytoplankton in a volcanic crater lake in the Galapagos than can be compared to the Palmyra atoll corals. (Extracting some neat El Nino frequency data, too.) So I'm not convinced that eventually there won't be better quantitative comparisons eventually.
The next statements we have to put together.
An incorrect statement regarding the IPCC’s role. The IPCC does not do ANY independent research. It evaluates and summarizes hundreds of climate papers authored by independent scientists. With few exceptions the IPCC scientists are selected based on their adherence to AGW.
I don't believe I was speaking about the IPCC scientists, I was speaking about the papers referenced in the report, of which there are truly hundreds. The IPCC doesn't do its own modeling. Happer's poorly worded statement implied that they did (or should have). Thus, he's not presenting correctly what the IPCC does, and therefore the statement is wrong: "The IPCC has made no serious attempt to model the natural variations of the earth’s temperature in the past."
As I noted, the IPCC has evaluated, and does include discussion of in the report, serious attempts to model the natural variations of Earth's climate in the past. So the statement is doubly wrong. Regarding the strawman of 20th century solar effects, that's not paleoclimate when last I checked.
It is ludicrous to talk about 800 years when the samples are smoothed and thousands of years apart.
Then the skeptics should dump this talking point immediately, in your opinion. You should inform the author of "The Skeptical Handbook". But let's check something. What exactly is the time resolution of the EPICA core?
The southern hemisphere at glacial terminations: insights from the Dome C ice core
From the Methods section: "In this study, we used the data obtained by continuous flow analysis (CFA), (Rothlisberger et al., 2000), which resulted in a high-resolution record (of the order of 1 cm, corresponding to less than a year in the Holocene, approximately 3 years at 410 ka BP during marine isotope stage (MIS) 11, and 20 years at 800 ka BP during MIS 20)."
So I would really rather not hear anymore about how the samples are thousands of years apart. They are 3 years apart approximately 400,000 years ago (for this study). For other types of data, Past polar temperature changes : EPICA Dome C record, PMIP2 model-data comparisons (PDF), they say "leading to a temporal resolution varying from a few decades during the last deglaciation to a few centuries 800 000 years ago." Still haven't made it to thousands of years. And other types of data, deep sea sediment cores, can provided carbon isotope resolution on the order of 25-50 years for periods 15-20,000 years ago.
So... the lag can be analyzed, and numerous studies support Milankovitch forcing with CO2 amplification of the initiated change direction (i.e., warming or cooling). And the CO2 does NOT come from warming ocean surface waters, an erroneous Happer point that I didn't number but one of his most egregious.
Moving on...
Point 9: But you didn't account the failure to predict the measured effects
Coupled ocean-atmosphere models obviously do get La Nina cooling (or El Nino warming) effects. I can't comment on how closely they get a correspondence between a certain degree of colder Pacific SST and cooler air temperatures. What they don't get right is La Nina or El Nino timing corresponding to actual events (i.e., either forecast or hindcast). That's because no one yet has figured out what initiates an El Nino or a La Nina. The models still generate El Ninos and La Ninas, though.
Regarding the Gore statement about hurricanes. Happer's statement implied that AIT attributed hurricane Katrina to CO2 (again, poorly worded); AIT doesn't even attribute Katrina or any hurricane to global warming, and the "Team Gore" response points out that the court finding got this wrong. The way that the court wrote it, they always put "error" in scare quotes. This is what the court actually said: "It was essential to appreciate that the hearing before me did not relate to an analysis of the scientific questions, but to an assessment of whether the 'errors' in question, set out in the context of a political film, informed the argument on ss406 and 407." I.E., the whole court finding wasn't about determining about scientific accuracy. It was about determining if a balanced viewpoint is presented "where political issues are brought to the attention of pupils". The judge determined that AIT discussed a political issue; you can read his reasoning as to why. So the "errors" in AIT are that a countering view was not presented where "there are errors or deviations from the mainstream by Mr Gore." As the Team Gore link demonstrates, they dispute the judge's characterizations that some of these points are deviations from the mainstream or that the judge accurately characterized what the film stated, with particular regard to hurricane Katrina.
But now you also say: It's the opposite, there's less evidence for the connection in Emanuels 2008 study than in his 2005 study.
The Team Gore statement came out in 2006, so I suppose they were talking about something that came out after Emmanuel 2005. But regarding Emmanuel 2008 (in April), have you read Elsner et al. 2008, which came out in September 2008? If not, you should. But I think it's a moot point. If global warming causes higher SSTs (it does), and formed tropical systems consistently encounter higher SSTs than a couple of decades ago, the storms are going to be consistently stronger. Hurricanes get stronger over warmer water. If anybody comes out with a paper that shows a decrease in hurricane intensity with warming SSTs, I really want to know why.
So that just about covers it. I'm thirsty and have to get another cold glass of alarmist Kool-aid. But first I have to point out your final error:
You choose to believe government and its biased scientists can do a better job with energy and the environment than private savings (conservation) and private enterprise (new supplies)
On the contrary, I think that major gains will be obtained from conservation, and our only way out of the energy conundrum is with a mix of new supplies. That means non-fossil fuel supplies. No matter what atmospheric CO2 does to the global climate, the fossil fuel economy is not sustainable, and it's not in our national economic and security best interest to try and keep it going.
 (from
(from 
