
FReepmail me to get on or off

 Climate Research News
Click on POGW graphic for full GW rundown
Ping me if you find one I've missed.
Posted on 02/28/2009 4:49:53 PM PST by Delacon
I guarantee you that even a Senator understands that anthropogenic global warming is great for getting bills passed containing unrelated legislation, earmarks, and etc., thus perpetuating the myth is in the Senator's favor.
I distress at how more clueless people have become in only 8 years.
Climate Research NewsClick on POGW graphic for full GW rundown
Ping me if you find one I've missed.
Delacon — I read every word, and you are correct. I was not disappointed. Thanks for posting.
Most people don't understand the concept of positive and negative feedback.
Even if you explain it to them, they will fall back on the "consensus of scientists" that believe in man made global warming.
The AGW movement is hiding behind this census to give them clout. They say "the debate is over, it is time to act, we are running out of time", to change the subject BECAUSE it is NOT a consensus.
I am a believer this is not simply a matter of public policy disagreement between the two sides. I BELIEVE IT IS A FRAUD DESIGNED TO CAUSE ECONOMIC HARM TO THE WESTERN WORLD FOR THE ADVANTAGE OF THE THIRD WORLD.
Their agenda driven accomplices like Hansen and Algore should be prosecuted for fraud. Why are they in such a hurry? If the science is really on their side, mankind will eventually do the right thing because it has no choice. They are in a hurry for self enrichment and/or pushing an anti-human, pro-earth agenda that is nothing more than a religion.
My point exactly, even it I didn't state it as well as you have.
As concerning the disproportionate burden of higher energy cost to the poor or the elderly living on "fixed" incomes: of course they feel the sting of those higher cost due to increases from these taxes. But most of them will only blame the electric company or the oil and gas companies for the price increase, and the Democrats will only be too happy to have them do so.
You and I both know that businesses pass on any cost increases inflicted on them (higher cost of any commodity used to produce or transport, ext.), but the average consumer doesn't! Most consumers have no idea why anything cost what it does, and could care less until the product in question increases in price, and then they get mad and blame the company or entity for being "greedy".
Basic business ignorance of the masses is exactly what the Democrats foster and exploit, thus perpetuating the vicious cycle of hatred for so called big business.
I would have hoped that the average American would have gotten wise to this by now, but after watching politics in this country for the last 35 years, it appears to me that they never will.
Now, I can predict the myriad responses to this.
Personal attacks -- I'm a liberal, I'm a socialist, I'm a scientist, I'm an apostle of Gore, I'm a Tarnsman of Gor, you know the type.
Numerous postings drawing my attention to stuff I've seen before which supposedly refutes one or more of my points (98% of which don't even come close)
Diatribes and monologues on how any action to address anthropogenic climate change is either a) a conspiracy or b) a plot to take over the world, or c) both.
Funny comments (rare, but it does happen)
Inane, not very funny comments, and
Reiterated talking points, such as my current favorite, the globe has been cooling for 10 years. Anybody who thinks this should be informed that trends are not determined (statistically) by drawing a line from the highest peak to the lowest trough. They are determined by a variety of line or curve-fitting analyses which are dependent on having a requisite number of data points and which usually should have some mechanism for excluding outliers. YMMV.
So here it is. Dr. Happer's statements are italicized, my comments are bolded.
10 things wrong with Dr. Happer’s testimony to Congress:
Let me state clearly where I probably agree with the other witnesses. We have been in a period of global warming over the past 200 years, but there have been several periods, like the last ten years, when the warming has ceased,
1. The warming has not ceased. The first decade of the 21st century has 8 of the top 10 warmest years in the instrumental record. Only until there are years with annual global mean temperature (GMT) . This includes 2005, which was statistically equivalent to the warmest-ranked year, 1998. 2005 did not have a large El Nino event, an event known to raise global temperatures. 1998 had the second-largest El Nino event of the 20th century. 
and there have even been periods of substantial cooling, as from 1940 to 1970. Atmospheric concentrations of carbon dioxide (CO2) have increased from about 280 to 380 parts per million over past 100 years. The combustion of fossil fuels, coal, oil and natural gas, has contributed to the increase of CO2 in the atmosphere. And finally, increasing concentrations of CO2 in the atmosphere will cause the earth’s surface to warm. The key question is: will the net effect of the warming, and any other effects of the CO2, be good or bad for humanity?
I believe that the increase of CO2 is not a cause for alarm and will be good for mankind. (following section about Prohibition deleted)
But what about the frightening consequences of increasing levels of CO2 that we keep hearing about? In a word, they are wildly exaggerated, just as the purported benefits of prohibition were wildly exaggerated. Let me turn now to the science and try to explain why I and many scientists like me are not alarmed by increasing levels of CO2.
The earth’s climate really is strongly affected by the greenhouse effect, although the physics is not the same as that which makes real, glassed-in greenhouses work. Without greenhouse warming, the earth would be much too cold to sustain its current abundance of life. However, at least 90% of greenhouse warming is due to water vapor and clouds. Carbon dioxide is a bit player. There is little argument in the scientific community that a direct effect of doubling the CO2 concentration will be a small increase of the earth’s temperature — on the order of one degree. Additional increments of CO2 will cause relatively less direct warming because we already have so much CO2 in the atmosphere that it has blocked most of the infrared radiation that it can. It is like putting an additional ski
2. This is incorrect, and is a common misconception among global-warming skeptics. CO2 in the atmosphere continues to absorb heat as concentration increases because the atmosphere is three-dimensional, and heat will continue to be absorbed in upper layers of the troposphere. This is explained FULLY in the following two articles:
hat on your head when you already have a nice warm one below it, but your are only wearing a windbreaker. To really get warmer, you need to add a warmer jacket. The IPCC thinks that this extra jacket is water vapor and clouds.
Since most of the greenhouse effect for the earth is due to water vapor and clouds, added CO2 must substantially increase water’s contribution to lead to the frightening scenarios that are bandied about. The buzz word here is that there is “positive feedback.” With each passing year, experimental observations further undermine the claim of a large positive feedback from water.
3. This is an astonishing assertion. Two supporting publications that indicate strong positive water vapor feedback:
Minschwaner, K., and A.E. Dessler. 2004. Water vapor feedback in the tropical upper troposphere: Model results and observations. Journal of Climate 17:1272-1282.
Dessler, A. E., Z. Zhang, and P. Yang (2008), Water-vapor climate feedback inferred from climate fluctuations, 2003–2008, Geophys. Res. Lett., 35, L20704, doi:10.1029/2008GL035333.
Abstract: Between 2003 and 2008, the global-average surface temperature of the Earth varied by 0.6°C. We analyze here the response of tropospheric water vapor to these variations. Height-resolved measurements of specific humidity (q) and relative humidity (RH) are obtained from NASA's satellite-borne Atmospheric Infrared Sounder (AIRS). Over most of the troposphere, q increased with increasing global-average surface temperature, although some regions showed the opposite response. RH increased in some regions and decreased in others, with the global average remaining nearly constant at most altitudes. The water-vapor feedback implied by these observations is strongly positive, with an average magnitude of λ q = 2.04 W/m2/K, similar to that simulated by climate models. The magnitude is similar to that obtained if the atmosphere maintained constant RH everywhere.
In fact, observations suggest that the feedback is close to zero and may even be negative. That is, water vapor and clouds may actually diminish the already small global warming expected from CO2, not amplify it. The evidence here comes from satellite measurements of infrared radiation escaping from the earth into outer space, from measurements of sunlight reflected from clouds and from measurements of the temperature the earth’s surface or of the troposphere, the roughly 10 km thick layer of the atmosphere above the earth’s surface that is filled with churning air and clouds, heated from below at the earth’s surface, and cooled at the top by radiation into space.
But the climate is warming and CO2 is increasing. Doesn’t this prove that CO2 is causing global warming through the greenhouse effect? No, the current warming period began about 1800 at the end of the little ice age, long before there was an appreciable increase of CO2. There have been similar and even larger warmings several times in the 10,000 years since the end of the last ice age. These earlier warmings clearly had nothing to do with the combustion of fossil fuels. The current warming also seems to be due mostly to natural causes, not to increasing levels of carbon dioxide.
4. Attribution studies indicate that the 20th century warming, particularly the late 20th century warming, is primarily due to human activities, primarily increasing atmospheric CO2 concentrations due to fossil fuel combustion.
The IPCC Explains… Unnatural Warming
Over the past ten years there has been no global warming, and in fact a slight cooling. This is not at all what was predicted by the IPCC models.
5. This is a repetition of the statement made at the beginning of the presentation and is refuted as Point 1. Also see comments in Point 7.
(Next historical section deleted)
The existence of climate variability in the past has long been an embarrassment to those who claim that all climate change is due to man and that man can control it. When I was a schoolboy, my textbooks on earth science showed a prominent “medieval warm period” at the time the Vikings settled Greenland, followed by a vicious “little ice age” that drove them out. So I was very surprised when I first saw the celebrated “hockey stick curve,” in the Third Assessment Report of the IPCC. I could hardly believe my eyes. Both the little ice age and the Medieval Warm Period were gone, and the newly revised temperature of the world since the year 1000 had suddenly become absolutely flat until the last hundred years when it shot up like the blade on a hockey stick. This was far from an obscure detail, and the hockey stick was trumpeted around the world as evidence that the end was near. We now know that the hockey stick has nothing to do with reality but was the result of incorrect handling of proxy temperature records and incorrect statistical analysis.
6. Dr. Happer is incorrect when he asserts that the MWP was removed from the well-known “hockey stick”. The MWP was most strongly manifested in the Northern Hemisphere and Europe; the inclusion of data from other parts of the world reduced the impact of this event. The first IPCC report contained a sketch that over-emphasized the size of the MWP, and this sketch has continued to circulate, even being used in “The Great Global Warming Swindle”, even though the sketch was not data-based. It has influenced the general public perception of the "size" of the MWP. The figure below shows a number of proxy temperature records going back to the year 1000. While the use of temperature proxies for such analyses has been shown to be increasingly unreliable beyond about 400 years in the past, there is no truth to the statement that the MWP and the LIA were “gone” from such records. Such a statement is based on an over-reliance on anecdotal memory and depictions or descriptions lacking scientific rigour, compared to actual data reconstructions, which can be evaluated (and critiqued) by scientific methodology, as has been done.

There really was a little ice age and there really was a medieval warm period that was as warm or warmer than today. ["Warmer" is not scientifically supported. It can't be; the proxies are not sufficiently accurate that far into the past.] I bring up the hockey stick as a particularly clear example that the IPCC summaries for policy makers are not dispassionate statements of the facts of climate change. It is a shame, because many of the IPCC chapters are quite good. The whole hockey-stick episode reminds me of the motto of Orwell’s Ministry of Information in the novel “1984:” “He who controls the present, controls the past. He who controls the past, controls the future.” The IPCC has made no serious attempt to model the natural variations of the earth’s temperature in the past. Whatever caused these large past variations, it was not due to people burning coal and oil. If you can’t model the past, where you know the answer pretty well, how can you model the future?
7. An incorrect statement regarding the IPCC’s role. The IPCC does not do ANY independent research. It evaluates and summarizes hundreds of climate papers authored by independent scientists. Chapter 6 of the Report of Working Group 1 (“The Scientific Basis”) in the Fourth IPCC report fully addresses paleoclimate, both short-term (Holocene) and long-term (over the entire Quaternary back to the beginning of the Paleocene). It addresses cause-and-effect of several different Quaternary events with regard to radiative forcing, and takes considerable effort to evaluate the glacial-interglacial era. So Dr. Happer does not truly represent the IPCC’s presentation on this topic in his statement above. Furthermore, atmospheric CO2’s role as a primary driver of global temperature for paleoclimate is underscored in multiple ways in the research that is presented and summarized/discussed in the IPCC reports.
Many of us are aware that we are living in an ice age, where we have hundred- thousand-year intervals of big continental glaciers that cover much of the land area of the northern hemisphere, interspersed with relative short interglacial intervals like the one we are living in now. By looking at ice cores from the Greenland and Antarctic ice sheets, one can estimate past temperatures and atmospheric concentrations of CO2. Al Gore likes to display graphs of temperature and CO2 concentrations over the past million years or so, showing that when CO2 rises, the temperature also rises. Doesn’t this prove that the temperature is driven by CO2? Absolutely not! If you look carefully at these records, you find that first the temperature goes up, and then the CO2 concentration of the atmosphere goes up. There is a delay between a temperature increase and a CO2 increase of about 800 years. This casts serious doubt on CO2 as a climate driver because of the fundamental concept of causality.
8. The supposed CO2-temperature lag has been addressed numerous times because it is a often-repeated (~ad infinitum) skeptical talking point. This point does not, in any way, negate the important role of CO2 climate forcing. I explain this with many supporting links in my profile (point #5). There are other Web site that also address this incorrect assertion:
The lag between temperature and CO2
New Scientist addresses this climate warming myth ("myth" is their term)
CO2 lags, not leads (both links are presented due to different discussion threads)
A cause must precede its effect. [This simple statement does not refute the simple fact that a triggering cause can induce secondary effects which may have a larger aggregate influence.] For example, I hear my furnace go on in the morning about six o’clock, and by about 7 o’clock, I notice that my house is now so warm that I have too many covers on my bed. It is time to get up. It would never occur to me to assume that the furnace started burning gas at 6 o’clock because the house got warm at 7 o’clock. Sure, temperature and gas burning are correlated, just like temperature and atmospheric levels of CO2. But the thing that changes first is the cause. In the case of the ice cores, the cause of increased CO2 is almost certainly the warming of the oceans. [I missed this in my evaluation. This is also wrong, because the total ocean SST change from glacials to interglacials would only produce about 10% of the total observed atmospheric CO2 increase by the mechanism described. The other 90% likely results from ocean circulation alteration and other mechanisms, which are addressed in the relevant point in my profile.] The oceans release dissolved CO2 when they warm up, just like a glass of beer rapidly goes flat in a warm room. If not CO2, then what really causes the warming at the end of the cold periods of ice ages? A great question and one of the reasons I strongly support research in climate. [It's been done; links to references are in my profile. While the final solution is not settled, the processes which could accomplish this are well-characterized.]
[Long following section deleted; this was about CO2 and plants. There was nothing incorrect in this section, but there is an implicit suggestion that returning to climate when there were no ice caps in either polar region is an acceptable outcome. Some might dispute that, particularly if such an outcome would be realized over centuries rather than millennia.]
Many of the frightening scenarios about global warming come from large computer calculations, “general circulation models,” that try to mimic the behavior of the earth’s climate as more CO2 is added to the atmosphere. It is true that climate models use increasingly capable and increasingly expensive computers. But their predictions have not been very good. For example, none of them predicted the lack of warming that we have experienced during the past ten years. All the models assume the water feedback is positive, while satellite observations suggest that the feedback is zero or negative.
9. Here Dr. Happer repeats two previous assertions which have been refuted earlier. It should also be noted that GCMs used for climate are different than coupled ocean-atmosphere models; the climate GCMs use a very simplified representation of the ocean. Only a coupled ocean-atmosphere GCM could simulate the warming effects of an El Nino or the cooling effects of a La Nina. Coupled ocean-atmosphere models do have El Nino and La Nina events, but predicting the actual timing of such events is similar to the ability of long-range weather forecasts (six months or longer) to predict the actual timing of snowstorms, which is to say that it can’t be done. So the recent cooling due to an extended La Nina event is not something that climate GCMs would do at all, and not something that coupled ocean-atmosphere models would do well.
[section about Lord Kelvin deleted; further historical musings also deleted]
Even elementary school teachers and writers of children’s books are enlisted to terrify our children and to promote the idea of impending climate doom. Having observed the education of many children, including my own, I am not sure how effective the effort will be. Many children seem to do just the opposite of what they are taught. Nevertheless, children should not be force-fed propaganda, masquerading as science. Many of you may know that in 2007 a British Court ruled that if Al Gore’s book, “An Inconvenient Truth,” was used in public schools, the children had to be told of eleven particularly troubling inaccuracies. You can easily find a list of the inaccuracies on the internet, but I will mention one.
10. The full finding of the court is here:
And an address of the supposed inaccuracies is found here:
Regarding Hurricane Katrina, the Team Gore response says:
“The film is careful not to ascribe any single weather event to climate change. However, in the film Mr. Gore does state, "There have been warnings that hurricanes would get stronger." He based that claim on research published in peer-reviewed journals from Dr. Kerry Emanuel, and several others, who have found a link between an increase in sea surface temperature and an increase in the intensity of hurricanes. Since then, further research has strengthened the science in this area with regards to a link between human-induced climate change and hurricane intensity. Mr. Gore has never addressed the issue of climate change and hurricane frequency.”
The court ruled that it was not possible to attribute hurricane Katrina to CO2. Indeed, had we taken a few of the many billions of dollars we have been spending on climate change research and propaganda and fixed the dykes [sic]and pumps around the New Orleans, most of the damage from Hurricane Katrina could have been avoided.
The sea level is indeed rising, just as it has for the past 20,000 years since the end of the last ice age. Fairly accurate measurements of sea level have been available since about 1800. These measurements show no sign of any acceleration. The rising sea level can be a serious local problem for heavily-populated, low-lying areas like New Orleans, where land subsidence compounds the problem. But to think that limiting CO2 emissions will stop sea level rise is a dangerous illusion. It is also possible that the warming seas around Antarctica will cause more snowfall over the continent and will counteract the sea-level rise. In any case, the rising sea level is a problem that needs quick local action for locations like New Orleans rather than slow action globally.
In closing, let me say again that we should provide adequate support to the many brilliant scientists, some at my own institution of Princeton University, who are trying to better understand the earth’s climate, now, in the past, and what it may be in the future. I regret that the climate-change issue has become confused with serious problems like secure energy supplies, protecting our environment, and figuring out where future generations will get energy supplies after we have burned all the fossil fuel we can find.
11. I fully agree with Dr. Happer’s statement above. Except for the last part, because as the supplies become depleted, the cost of extraction will eventually become prohibitive.
We should not confuse these laudable goals with hysterics about carbon footprints. For example, when weighing pluses and minuses of the continued or increased use of coal, the negative issue should not be increased atmospheric CO2, which is probably good for mankind. We should focus on real issues like damage to the land and waterways by strip mining, inadequate remediation, hazards to miners, the release of real pollutants and poisons like mercury, other heavy metals, organic carcinogens, etc. Life is about making decisions and decisions are about trade-offs. The Congress can choose to promote investment in technology that addresses real problems and scientific research that will let us cope with real problems more efficiently. Or they can act on unreasonable fears and suppress energy use, economic growth and the benefits that come from the creation of national wealth.
Because I can't reply I'm not going to reply. This was the product of a few hours of work and investigation (though I did have an idea where to look). I invite anyone truly interested in the science to investigate the topics independently and to discuss them with experts. That would disqualify me from further discussion.
Thanks, going out today, but I’ll read and comment on it tonight.
The confusing graphic that you show does not address his last 10 years are flat statement. Nor does your counter statment that 8/10 of the warmest years... address it either. He said 10 years are flat. The data is here http://hadobs.metoffice.com/hadcrut3/diagnostics/global/nh+sh/monthly and shows the last 10 years of anomalies as 0.296 0.270 0.408 0.464 0.473 0.447 0.482 0.422 0.405 and 0.324 in from 99 to 08. Verdict: not completely flat but close enough.
2. ...CO2 in the atmosphere continues to absorb heat as concentration increases because the atmosphere is three-dimensional, and heat will continue to be absorbed in upper layers of the troposphere.
Not true, the main GH gas in the upper troposphere is water vapor which has been shown to be dropping (e.g. Paltridge). RealClimate did their typical nonquantitative handwave in those articles. The key point they miss is that water vapor feedback is controlled at the earth's surface by evaporation, condensation and other weather, so it doesn't matter how much CO2 warming takes place in the upper troposphere. The bottom line is that doubling CO2 causes 0.25 degrees of warming period end of story and any projection above that is due to water vapor feedback.
3. This is an astonishing assertion. Two supporting publications that indicate strong positive water vapor feedback:
The M&D paper tries to deny the theoretical claims of UT drying by Lindzen and others with a model with exactly one grid point (vertical resultion of 300). We've discussed before how it is impossible to properly simulate weather such as convection without at least mesoscale resolution. For example with concentrated convection you will have subsidence around it which is cooling (the concentrated convection may or may not be depending on how much water vapor stays in the upper atmosphere. Their model with one horizontal point attempts to roll the convection and subsidence into one by parameterizing each. They dismiss a couple of models with mesoscale horizontal resolution (one of which points to lower UT RH). Reality says they are wrong, the UT is drying. It is astonishing that you would only look at a very poor model and ignore reality. Dessler in 2008 at least acknowledges the variation in UT RH (I don't have the paper, just your abstract), but it is quite incorrect to use any kind of constant UT RH comparison. The whole point of UT RH is that it isn't constant because of weather and if you deny that or don't properly simulate weather you will never get anywhere.
4. Attribution studies indicate that the 20th century warming, particularly the late 20th century warming, is primarily due to human activities, primarily increasing atmospheric CO2 concentrations due to fossil fuel combustion.
The link you provide just repeats the aerosol canard: During the 1950s and 1960s, average global temperatures leveled off, as increases in aerosols from fossil fuels and other sources cooled the planet. But later we found out that one of the reasons global temperatures "leveled off" was a switch from using WWII engine inlets to the prior method of uninsulated buckets and then gradually back to engine inlets by the end of the 70's. The rest of the article is similarly bogus, relying on coarse models tweaked to match measurements (wrong ones as well as correct ones). Models that can't do mesoscale weather, as discussed above, have no hope of properly determine water vapor feedback.
6. Dr. Happer is incorrect when he asserts that the MWP was removed from the well-known "hockey stick". The MWP was most strongly manifested in the Northern Hemisphere and Europe; the inclusion of data from other parts of the world reduced the impact of this event
Unfortunately you will never get anywhere with the hockey stick. The problems were explained here in 2005: http://www.uoguelph.ca/~rmckitri/research/McKitrick-hockeystick.pdf The two major problems are decentering (scaling based on variance in the 20th century portion of the data) and autocorrelation. The first problem is shown in figure 5, the second in figure 7.
7. An incorrect statement regarding the IPCC’s role. The IPCC does not do ANY independent research. It evaluates and summarizes hundreds of climate papers authored by independent scientists.
With few exceptions the IPCC scientists are selected based on their adherence to AGW. It addresses cause-and-effect of several different Quaternary events with regard to radiative forcing So what? They certainly do not address any solar effects in 20th century warming. Tossing around multi-thousand-year smoothed CO2 and temperature estimates from 600k years ago is of no use to either side in this debate, never has been and never will be. It is ludicrous to talk about 800 years when the samples are smoothed and thousands of years apart. The only relevant question is whether CO2 increases can cause catastrophic warming and the answer is not without water vapor.
8. The supposed CO2-temperature lag has been addressed numerous times because it is a often-repeated (~ad infinitum) skeptical talking point.Agree and irrelevant, see above
9. ...Coupled ocean-atmosphere models do have El Nino and La Nina events, but predicting the actual timing of such events is similar to the ability of long-range weather forecasts (six months or longer) to predict the actual timing of snowstorms,
True, La Nina is evident in the temperatures I posted at the beginning. But you didn't account the failure to predict the measured effects (e.g. UT RH decrease is just one of many examples).
Mr. Gore does state, "There have been warnings that hurricanes would get stronger." He based that claim on research published in peer-reviewed journals from Dr. Kerry Emanuel, and several others, who have found a link between an increase in sea surface temperature and an increase in the intensity of hurricanes. Since then, further research has strengthened the science in this area with regards to a link between human-induced climate change and hurricane intensity
It's the opposite, there's less evidence for the connection in Emanuels 2008 study than in his 2005 study.
11. I fully agree with Dr. Happer’s statement above. Except for the last part, because as the supplies become depleted, the cost of extraction will eventually become prohibitive.
You choose to believe government and its biased scientists can do a better job with energy and the environment than private savings (conservation) and private enterprise (new supplies) and you are willing to drink any amount of alarmist koolaid to justify that choice. The world has proven your point of view wrong endless numbers of times. The bottom line is if the government gets out of the way and stops taxing the hell out of energy (5 to 1 ratio of taxes to profit) then we will have plenty of energy forever with perhaps a bit of beneficial warming or perhaps not. The worst case result is Greenland melts in a few centuries which I'm not going to worry about.
Great post Delacon.
ping
Great post Delacon.
ping
Look, if you send this to the New York Times I'm sure they'd be happy to publish it...
/s ( just kidding )
You missed the point here. What Happer says is: "We have been in a period of global warming over the past 200 years, but there have been several periods, like the last ten years, when the warming has ceased," The point of the graphic is that judging global warming based on variability of temperatures over a decade is pointless. The 1980s are warmer than the 1970s, the 1990s are warmer than the 1980s, and this decade is warmer than the 1990s. That's what the graphic clearly shows. Global warming is a signal within the noise of interannual variability. The signal emerges on decadal time-scales, not annual. A further way to show this:

or this
 In summary, to say that warming has "ceased' when looking at only 10 years of data is obviously fallacious. But because the current ten-year trend is flat, it's a popular thing for skeptics to do.
CO2 in the atmosphere continues to absorb heat as concentration increases because the atmosphere is three-dimensional, and heat will continue to be absorbed in upper layers of the troposphere.
Not true... but this isn't about water vapor. First of all, it's about CO2. I have to wonder, where do you get 0.25 C for direct forcing of temperature for CO2 doubling? The atmospheric models put it at 0.8-0.9 C; I can track that down if necessary. But back to CO2. From the second link about this ("What Angstrom didn't know")
"The absorption factor, so defined, is given in the following figure, based on the thousands of measurements in the HITRAN spectroscopic archive. The "fuzz" on this graph is because the absorption actually takes the form of thousands of closely spaced partially overlapping spikes. If one were to zoom in on a very small portion of the wavelength axis, one would see the fuzz resolve into discrete spikes, like the pickets on a fence. At the coarse resolution of the graph, one only sees a dark band marking out the maximum and minimum values swept out by the spike. These absorption results were computed for typical laboratory conditions, at sea level pressure and a temperature of 20 Celsius. At lower pressures, the peaks of the spikes get higher and the valleys between them get deeper, leading to a broader "fuzzy band" on absorption curves like that shown below."
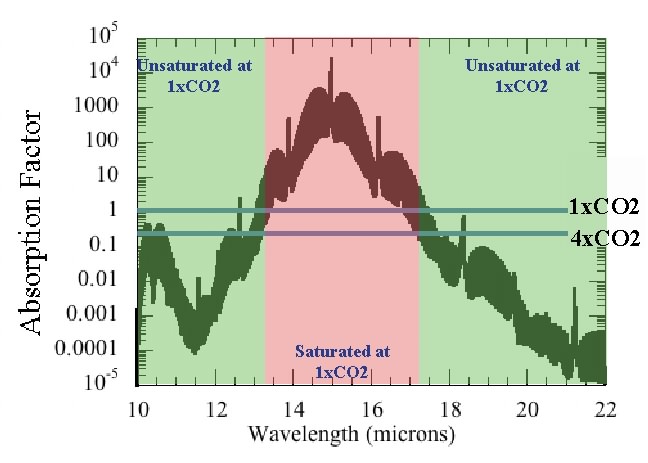
"We see that for the pre-industrial CO2 concentration, it is only the wavelength range between about 13.5 and 17 microns (millionths of a meter) that can be considered to be saturated. Within this range, it is indeed true that adding more CO2 would not significantly increase the amount of absorption. All the red M&M's are already eaten. But waiting in the wings, outside this wavelength region, there's more goodies to be had. In fact, noting that the graph is on a logarithmic axis, the atmosphere still wouldn't be saturated even if we increased the CO2 to ten thousand times the present level. What happens to the absorption if we quadruple the amount of CO2? That story is told in the next graph:"
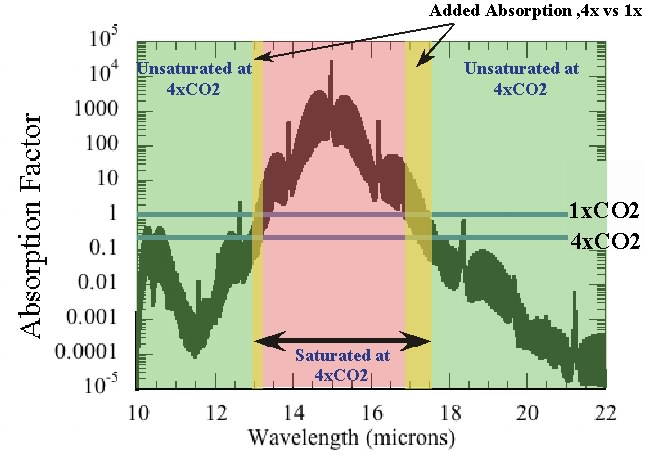
"The horizontal blue lines give the threshold CO2 needed to make the atmosphere optically thick at 1x the preindustrial CO2 level and 4x that level. Quadrupling the CO2 makes the portions of the spectrum in the yellow bands optically thick, essentially adding new absorption there and reducing the transmission of infrared through the layer. One can relate this increase in the width of the optically thick region to the "thinning and cooling" argument determining infrared loss to space as follows. Roughly speaking, in the part of the spectrum where the atmosphere is optically thick, the radiation to space occurs at the temperature of the high, cold parts of the atmosphere. That's practically zero compared to the radiation flux at temperatures comparable to the surface temperature; in the part of the spectrum which is optically thin, the planet radiates at near the surface temperature. Increasing CO2 then increases the width of the spectral region where the atmosphere is optically thick, which replaces more of the high-intensity surface radiation with low-intensity upper-atmosphere radiation, and thus reduces the rate of radiation loss to space."
Now, getting back to that point about 0.25 C with doubling, even Happer himself said: "There is little argument in the scientific community that a direct effect of doubling the CO2 concentration will be a small increase of the earth’s temperature — on the order of one degree.". Which agrees with what I've read (and which I can dig up if you need me to). So I've got no clue why you're stating something in opposition to even what the chosen skeptic here says.
Moving on:
Point 3, about water vapor feedback. Dessler in 2008 at least acknowledges the variation in UT RH (I don't have the paper, just your abstract), but it is quite incorrect to use any kind of constant UT RH comparison. Dessler's abstract just says that it's "similar" to the atmosphere maintaining constant RH. AIRS data provides their result, and Remote Sensing Systems gets a measured positive water vapor increase with increasing atmospheric temperature from MSU. So it's futile to refute the point, IMO. You're the weather expert, keep on disputing it if you feel it necessary.
Point 4, attribution studies: The disconnection in the water bucket SST measurements explained a glitch, not the overall cooler temperatures of the 60s and 70s. That's still mainly attributed to anthropogenic SO2, maybe with a kick from volcano Agung 1963. Your assertion that the models are tweaked has to be supported. Critique the following if possible: Ensemble Climate Simulations With Anthropogenic and Natural Forcings. This is similar to what the IPCC says, though I don't know if this specific study is cited in the Fourth Assessment Report.
Unfortunately you will never get anywhere with the hockey stick. The problems were explained here in 2005: http://www.uoguelph.ca/~rmckitri/research/McKitrick-hockeystick.pdf The two major problems are decentering (scaling based on variance in the 20th century portion of the data) and autocorrelation. The first problem is shown in figure 5, the second in figure 7.
I wasn't attempting to validate the hockey stick; I was merely pointing out that the MWP wasn't removed. What Happer doesn't mention and what the reexaminations of the hockey stick concluded was (at the time) that nothing quantitatively reliable could be said about temperatures more than 400 years ago. So when talking about the MWP, how can Happer happily conclude "there really was a medieval warm period that was as warm or warmer than today"? What anecdotal qualitative evidence is he basing that statement on? And if it's qualitative, it could have been cooler than, as warm as, or warmer than today. He can't make a definitive statement, yet he does anyway.
There's new studies out there, by the way. Some very interesting stuff from freshwater phytoplankton in a volcanic crater lake in the Galapagos than can be compared to the Palmyra atoll corals. (Extracting some neat El Nino frequency data, too.) So I'm not convinced that eventually there won't be better quantitative comparisons eventually.
The next statements we have to put together.
An incorrect statement regarding the IPCC’s role. The IPCC does not do ANY independent research. It evaluates and summarizes hundreds of climate papers authored by independent scientists. With few exceptions the IPCC scientists are selected based on their adherence to AGW.
I don't believe I was speaking about the IPCC scientists, I was speaking about the papers referenced in the report, of which there are truly hundreds. The IPCC doesn't do its own modeling. Happer's poorly worded statement implied that they did (or should have). Thus, he's not presenting correctly what the IPCC does, and therefore the statement is wrong: "The IPCC has made no serious attempt to model the natural variations of the earth’s temperature in the past."
As I noted, the IPCC has evaluated, and does include discussion of in the report, serious attempts to model the natural variations of Earth's climate in the past. So the statement is doubly wrong. Regarding the strawman of 20th century solar effects, that's not paleoclimate when last I checked.
It is ludicrous to talk about 800 years when the samples are smoothed and thousands of years apart.
Then the skeptics should dump this talking point immediately, in your opinion. You should inform the author of "The Skeptical Handbook". But let's check something. What exactly is the time resolution of the EPICA core?
The southern hemisphere at glacial terminations: insights from the Dome C ice core
From the Methods section: "In this study, we used the data obtained by continuous flow analysis (CFA), (Rothlisberger et al., 2000), which resulted in a high-resolution record (of the order of 1 cm, corresponding to less than a year in the Holocene, approximately 3 years at 410 ka BP during marine isotope stage (MIS) 11, and 20 years at 800 ka BP during MIS 20)."
So I would really rather not hear anymore about how the samples are thousands of years apart. They are 3 years apart approximately 400,000 years ago (for this study). For other types of data, Past polar temperature changes : EPICA Dome C record, PMIP2 model-data comparisons (PDF), they say "leading to a temporal resolution varying from a few decades during the last deglaciation to a few centuries 800 000 years ago." Still haven't made it to thousands of years. And other types of data, deep sea sediment cores, can provided carbon isotope resolution on the order of 25-50 years for periods 15-20,000 years ago.
So... the lag can be analyzed, and numerous studies support Milankovitch forcing with CO2 amplification of the initiated change direction (i.e., warming or cooling). And the CO2 does NOT come from warming ocean surface waters, an erroneous Happer point that I didn't number but one of his most egregious.
Moving on...
Point 9: But you didn't account the failure to predict the measured effects
Coupled ocean-atmosphere models obviously do get La Nina cooling (or El Nino warming) effects. I can't comment on how closely they get a correspondence between a certain degree of colder Pacific SST and cooler air temperatures. What they don't get right is La Nina or El Nino timing corresponding to actual events (i.e., either forecast or hindcast). That's because no one yet has figured out what initiates an El Nino or a La Nina. The models still generate El Ninos and La Ninas, though.
Regarding the Gore statement about hurricanes. Happer's statement implied that AIT attributed hurricane Katrina to CO2 (again, poorly worded); AIT doesn't even attribute Katrina or any hurricane to global warming, and the "Team Gore" response points out that the court finding got this wrong. The way that the court wrote it, they always put "error" in scare quotes. This is what the court actually said: "It was essential to appreciate that the hearing before me did not relate to an analysis of the scientific questions, but to an assessment of whether the 'errors' in question, set out in the context of a political film, informed the argument on ss406 and 407." I.E., the whole court finding wasn't about determining about scientific accuracy. It was about determining if a balanced viewpoint is presented "where political issues are brought to the attention of pupils". The judge determined that AIT discussed a political issue; you can read his reasoning as to why. So the "errors" in AIT are that a countering view was not presented where "there are errors or deviations from the mainstream by Mr Gore." As the Team Gore link demonstrates, they dispute the judge's characterizations that some of these points are deviations from the mainstream or that the judge accurately characterized what the film stated, with particular regard to hurricane Katrina.
But now you also say: It's the opposite, there's less evidence for the connection in Emanuels 2008 study than in his 2005 study.
The Team Gore statement came out in 2006, so I suppose they were talking about something that came out after Emmanuel 2005. But regarding Emmanuel 2008 (in April), have you read Elsner et al. 2008, which came out in September 2008? If not, you should. But I think it's a moot point. If global warming causes higher SSTs (it does), and formed tropical systems consistently encounter higher SSTs than a couple of decades ago, the storms are going to be consistently stronger. Hurricanes get stronger over warmer water. If anybody comes out with a paper that shows a decrease in hurricane intensity with warming SSTs, I really want to know why.
So that just about covers it. I'm thirsty and have to get another cold glass of alarmist Kool-aid. But first I have to point out your final error:
You choose to believe government and its biased scientists can do a better job with energy and the environment than private savings (conservation) and private enterprise (new supplies)
On the contrary, I think that major gains will be obtained from conservation, and our only way out of the energy conundrum is with a mix of new supplies. That means non-fossil fuel supplies. No matter what atmospheric CO2 does to the global climate, the fossil fuel economy is not sustainable, and it's not in our national economic and security best interest to try and keep it going.
What Happer said is correct. Please don't display any more GISS graphics, it has been discussed thoroughly on climateaudit and the GISS results cannot be reproduced. They are not scientific. Looking at the second graphic, you admit that "looking at only 10 years of data is obviously fallacious". Fallacy or not, what Happer said is correct. Whether or not it is a "popular thing for skeptics to do" is not relevant.
(2) Not true... but this isn't about water vapor. First of all, it's about CO2. I have to wonder, where do you get 0.25 C for direct forcing of temperature for CO2 doubling? The atmospheric models put it at 0.8-0.9 C; I can track that down if necessary. But back to CO2. From the second link about this ("What Angstrom didn't know")
If you have a link from a site that allows scientific discussion without censorship, then post it. If all you have is RealClimate, I am not interested. I tried discussing the science there, always politely, and I got a rude response from Mark. Nobody stopped him or criticized him. Any persistent and serious skeptic is insulted with the approval of the management while they censor other critical comments.
You are right though, 0.7 to 0.9 C increase for the increased forcing of 3 to 4 W/m2 for the doubling of CO2. The other number came from somewhere wrong that I can no longer find. They probably assumed less forcing. But like I said if you have a site where LBL CO2 doubling is debated in a professional manner, let me know. It is not correct to say that LBL analysis is settled science and the increased energy from forcing is still very much in doubt.
(3) Dessler's abstract just says that it's "similar" to the atmosphere maintaining constant RH. AIRS data provides their result, and Remote Sensing Systems gets a measured positive water vapor increase with increasing atmospheric temperature from MSU.
The point is not that water vapor increases with temperature, but that UT is drying and cooling in contrast to the models. The most basic problem is that the models lack proper simulation of concentrated convection because they don't have fine enough resolution. It is still astonishing that you continue to ignore this reality (except for Gavin's misleadingly scaled RAOB data). The models are wrong, there is no strong positive water vapor feedback.
(4) Point 4, attribution studies: The disconnection in the water bucket SST measurements explained a glitch, not the overall cooler temperatures of the 60s and 70s. That's still mainly attributed to anthropogenic SO2, maybe with a kick from volcano Agung 1963. Your assertion that the models are tweaked has to be supported.
9 out of 9 climate models studied were tweaked: (from http://www.climateaudit.org/?p=2475#more-2475)
(6) I wasn't attempting to validate the hockey stick; I was merely pointing out that the MWP wasn't removed. What Happer doesn't mention and what the reexaminations of the hockey stick concluded was (at the time) that nothing quantitatively reliable could be said about temperatures more than 400 years ago.
Two incorrect comments. The first is a repetition of a lie. The MWP was removed in 1999
and put back later:
so they could say it wasn't really removed. For the MWP deniers like yourself, obviously no amount of evidence like this The degree of summer melt was significantly larger during the period 1130-1300 than in the 1990s. ( http://www.agu.org/pubs/crossref/2006/2005JD006494.shtml) will convince you.
(7) I don't believe I was speaking about the IPCC scientists, I was speaking about the papers referenced in the report, of which there are truly hundreds. The IPCC doesn't do its own modeling. Happer's poorly worded statement implied that they did (or should have). Thus, he's not presenting correctly what the IPCC does, and therefore the statement is wrong: "The IPCC has made no serious attempt to model the natural variations of the earth’s temperature in the past."
His statement is poorly worded but not incorrect. When he uses the term IPCC, he refers to the scientists selecting the papers and the papers that they selected. Were the IPCC authors serious in including models that included natural variations? Not unless you count using erroneous solar data ( http://wattsupwiththat.com/2009/03/05/ipcc-20th-century-simulations-get-a-boost-from-outdated-solar-forcings/)
(8) But let's check something. What exactly is the time resolution of the EPICA core?
From the Methods section: "In this study, we used the data obtained by continuous flow analysis (CFA), (Rothlisberger et al., 2000), which resulted in a high-resolution record (of the order of 1 cm, corresponding to less than a year in the Holocene, approximately 3 years at 410 ka BP during marine isotope stage (MIS) 11, and 20 years at 800 ka BP during MIS 20)." So I would really rather not hear anymore about how the samples are thousands of years apart. They are 3 years apart approximately 400,000 years ago (for this study).
That has to be about the most misleading statement I have ever heard in this field. Here's an example of gas diffusion through ice: http://www1.ncdc.noaa.gov/pub/data/paleo/icecore/antarctica/vostok/co2.txt You can see that atmospheric air leaks into the ice for thousands of years as the ice (snow) is deposited. Similarly, gas moves within the ice over time and never stops moving, so older ice will have more smoothed gas measurements. A typical sampling at depth will produce very few readings. The author of your statement is confusing (whether deliberately or not) surface measurement techniques with sampling at depth.
Both examples are given in this article http://www.climate.unibe.ch/~stocker/progress0306.pdf which explains that the CFA was done on firn (snow), not ice. It used snow from 4 to 143 cm below the surface. The second thing to note in this article is that there were 1651 measurements over 200ka prior to 400kabp. I realize that's a different core, but the same sparse measurements apply at that age, and CFA is completely inapplicable. The average they give is 700 years between samples, but that itself is very misleading since the compression varies at depth. Note the top axis in Figure 9 with varying warmth compressing ice from 1cm/year to 4-5 cm/year (the poor resolution makes it impossible to tell what the real variance is).
So... the lag can be analyzed, and numerous studies support Milankovitch forcing with CO2 amplification
GIGO
(9) The Team Gore statement came out in 2006, so I suppose they were talking about something that came out after Emmanuel 2005. But regarding Emmanuel 2008 (in April), have you read Elsner et al. 2008, which came out in September 2008? If not, you should. But I think it's a moot point.
The Elsner paper doesn't say anything about storm strength as measured by realistic measurements like ACE. Basically just an example of cherry picking a statistic.
(govt meddling) On the contrary, I think that major gains will be obtained from conservation, and our only way out of the energy conundrum is with a mix of new supplies. That means non-fossil fuel supplies. No matter what atmospheric CO2 does to the global climate, the fossil fuel economy is not sustainable, and it's not in our national economic and security best interest to try and keep it going.
The economy will be sustained by eliminating government interference in energy which can easily be sustained for hundreds of years with fossil fuels.
I had hoped that ‘ole Cog would leave us for good. You would have a better chance of convincing Al Gore.
He’s written a few opuses, but apparently we are too stupid to be left unsupervised.
LOL. So true. We are “too stupid” for his climate change dogma.
ftp://ftp.ncdc.noaa.gov/pub/data/paleo/icecore/antarctica/epica_domec/edc-co2-2008.txt
It'll take a few days to address the rest of what you wrote. You correctly pointed out that the lag issue is dependent on the time-resolution of the ice cores. As the link above shows, the gas age resolution is dependent on the site and the age -- the farther back you go, obviously the longer the periods are. That doesn't mean that the timing or "lag" can't be examined at much better resolution than thousands of years, as you imply; it can be examined for the most recent glacial and interglacial transitions. The EPICA time resolution that I was speaking of was not for gas ages, it was for temperature and climate proxies. If you'd read the paper you'd have known that.
But the lag issue is a moot point. What I said was this:
"8. The supposed CO2-temperature lag has been addressed numerous times because it is a often-repeated (~ad infinitum) skeptical talking point. This point does not, in any way, negate the important role of CO2 climate forcing. I explain this with many supporting links in my profile (point #5). There are other Web sites that also address this incorrect assertion:" and "This simple statement does not refute the simple fact that a triggering cause can induce secondary effects which may have a larger aggregate influence."
Happer's point with the use of the lag timing is to attempt to refute the necessary role of atmospheric CO2 concentration as the primary paleoclimate temperature determinant. In very basic terms, the only climate driver capable of causing the glacial-interglacial temperature change (or interglacial-glacial temperature change, if you prefer) is the ~80 ppm change in atmospheric CO2 concentrations, aided secondarily by the albedo change caused by continental ice sheets. There's no other climatically realistic way to do it, and that's why Happer was wrong on this particular point.
I'm glad you finally noticed the time resolution granularity, about 1000-1500 years at the bottom. The CO2 cannot be measured at any finer resolution and contains at least 4000 years of CO2 smoothed into one measurement as I pointed out above. So there can't be any possible verification that CO2 "peaked" at this or that in the past. It is simply impossible to say anything conclusive about the peaks. Your statement about resolution is still inapplicable, it is nonsensical to express years of resolution when gases are smoothed at 1000's of years. That result is just lots of garbage data.
As for lag, the same gas diffusion problem complicates things. The temperature proxy comes from the ice itself which is roughly 4000 years younger than the CO2 along side of it. That delta varies based on climate when the ice was deposited. What Happer is saying about the lag is that the CO2 is a positive feedback from warmth and there is no indication that the warmth is anything other than predominately non-CO2 generated.
Here is what Happer said that was wrong. " but there have been several periods, like the last ten years, when the warming has ceased,". The basis for his statement is a peak-to-valley trend line. (1998 peak, 2007 valley). To make the statement he made based on this method of analysis is fallacious -- and also wrong. The Hadley CRUT3 plot I provided demonstrated that this decade is warmer than the 1990s, and the 1990s were warmer than the 1980s, etc. That's how climate should be evaluated.
As for GISTEMP and its "scientificness" or validity, Happer's statement is based on an evaluation of the surface temperature record. Since he doesn't specify NOAA, GISS, or Hadley Centre, I should be entitled to post a graphic about the surface temperature record. There is so little difference between them that the same basic plot could be generated from any of the three records. You might claim that all three datasets are "unscientific", but if Happer is going to talk about them, then we have to talk about them too. (Besides, how wrong are they when they show cooling due to volcanoes and they even discriminate the El Chichon cooling from the subsequent El Nino warming?)
If you have a link from a site that allows scientific discussion without censorship, then post it. If all you have is RealClimate, I am not interested.
Factz iz factz. Those two posts from RealClimate are by far the best full explanation about why the CO2 saturation in the atmosphere card played by Happer is bogus. "History of Global Warming" gets into some of that, but not with the graphics that make it nice and clear.
The point is not that water vapor increases with temperature, but that UT is drying and cooling in contrast to the models. The most basic problem is that the models lack proper simulation of concentrated convection because they don't have fine enough resolution.
You're the meteorologist, not I. I'd like to have the reference for UT drying and cooling; I do know that at some point the atmosphere switches from warming in the lower layers to cooling in the upper layers, because the stratosphere cools radiatively (and this cooling signal is evidence for the current action of CO2 in trapping increasing amounts of longwave radiation in the troposphere). Are you talking about a transitional zone with regards to the UT? Furthermore, does UT drying and cooling affect LT warming and the expected changes due to that?
Regarding Point 4, simulation of 20th century warming, i.e. attribution studies. You didn't comment on the link I posted, so here it is again:
Ensemble Climate Simulations With Anthropogenic and Natural Forcings
This is one sentence from the abstract: "In the remaining three ensembles, forcings from anthropogenic sulfate aerosols, solar variability, and volcanic aerosols in the stratosphere are added progressively, such that the fourth ensemble uses all four of these forcings."
Does that process constitute "tweaking" according to the Climate Audit link that you posted? I don't think it does, because of this comment: "In many models aerosol forcing is not applied as an external forcing, but is calculated as an integral component of the system. Many current models predict aerosol concentrations interactively within the climate model and this concentration is then used to predict the direct and indirect forcing effects on the climate system."
BTW, here's the Kiehl paper: Twentieth century climate model response and climate sensitivity
I made an attempt to see if any of the authors from the NOAA/GFDL study were also included in any of the 9 models Kiehl analyzed. It doesn't look like it. My question is, and if you can answer it, I'll be impressed: is Kiehl only analyzing a certain subset type of GCMs? I don't know. I submit that Kiehl is not the last word on the subject.
Two incorrect comments. The first is a repetition of a lie. The MWP was removed in 1999
How is it a lie when the period 1000-1300 is about 0.2 C warmer than the two low periods from ~1600-1700 and from ~1800 to ~1900? It's less than the IPCC cartoon from the first report would make it appear it "should" have been, and the second graph shows the range of variability possible from different proxy estimates (I think Moberg 2005 had the widest range) -- and subsequent work indicated that there's a lot less certainty about any temperatures after 1600 based on proxies. The original Mann "hockey stick" was flawed, but the MWP was not removed. That's just a popular talking point.
Regarding the Svalbard data: I think there's general agreement that both the MWP and the LIA were most strongly felt in Europe. So you provide a link that demonstrates the MWP being strongly evidenced in Europe! I don't deny that. I don't deny evidence for the MWP in New Zealand, either. What I deny is that the MWP was removed from the proxy temperature records, especially with the implication that it was deliberately removed.
Beyond that, I'm providing a link to Dr. Mann's congressional testimony.
Senator Inhofe’s Follow-up Questions for Dr. Michael Mann There are two points where the Medieval Warm Period and the Little Ice Age are explicitly discussed. (Responses to questions 2 and 7.) These cover the issue of synchronicity and why if there isn't synchronicity in warming or cooling, a global record (to the extent that is possible) will not show the same timing or magnitude of warming or cooling as a regional record.
Further discussion of CO2 timing and lag:
A new hypothesis for deglacial CO2 rise? (conveniently posted on March 14!!!)
Permit me to quote a comment from Dr. Anderson, the lead author: "The fact that atmospheric CO2 lagged behind the initial change in climate at the end of past ice ages is a red herring frequently tossed around by global warming skeptics. No scientist that I know believes that changes in CO2 provided the initial cause of glacial-interglacial climate change. Rather, CO2 represents a feedback that amplified climate change that was triggered by other processes. It was recognized decades ago that insolation alone is likely insufficient to drive the changes in earth’s climate between glacial and interglacial periods. Scientists were looking for a feedback mechanism to amplify the effects of insolation before the first ice core records revealed that atmospheric CO2 was lower during glacial periods. It seems that CO2 provides that amplifier." The next part of the response explains (again) why Happer is wrong, along with numerous skeptics, about the source of the increased atmospheric CO2 during interglacials. Happer's paragraph beginning "Many of us are aware..." is the wrongest paragraph in the whole mishmash. You've brought up timing and gas diffusion and many other issues. That's fine. The basic facts are that CO2 increases by 80-100 ppm from a glacial to an interglacial and it's that change that drives (with the inclusion of positive water vapor feedback and reduction of albedo) the glacial-interglacial temperature increase. There is no other way to do it short of a variable Sun far more variable than any evidence or observations indicate.
I took a look at the solar forcing link. That only addresses the 20th century (well, back to 1880), and my initial reaction is that if there is less solar variability at the beginning of the 20th century in the "outdated" analysis, then something else has to step in to explain it. I know what I think, but I'll stop there. But Happer's statement was in the context of his MWP discussion, and it's not true; they have attempted to figure out what caused this variability. It appears to be a combination of natural variability (definitely with an ocean component) and the well-known sunspot minima periods. On longer time-scales, then you get into glacial-interglacial forcing; on really long time-scales, you get into tectonically-related CO2 forcing.
Regarding hurricane strength and SST, feel free to explain what you perceive as the flaws with Elsner et al. 2008. I still (perhaps naively) think that the basic SST-intensity relationship would have to manifest itself somehow.
The economy will be sustained by eliminating government interference in energy which can easily be sustained for hundreds of years with fossil fuels.
Boy do I wish I had a time machine capable of parallel-universe visitation with driver-defined economic and climate settings. All we have currently now is computer models.
If it makes you happy, I've basically stopped responding to actual stupid statements about global warming here on FR. There just isn't enough time in the year. This was a classic about the underwater volcano eruption in the Tongan archipelago: "It gave me an opportunity to explain and illustrate with these pictures the fact that most of the “global warming” on the planet is due to a natural phenomenon: underwater volcanic activity, especially prevalent in the Pacific “ring of fire”. (Someone else bombed that one.) Or this: "I have read that volcanism produces more particulate matter and CO2 in a year than the entire cumulative output of all machines, vehicles, and factories since the beginning of the Industrial Revolution." Fortunately someone else responded to that one, too. (And there is a difference between the amount of particulate aerosol produced and the amount of CO2, but only a significant volcanic eruption -- such as the recent Chaiten -- puts a lot of ash into the atmosphere. Actually, darn it, I'm going to have to investigate this one.)
Later.
Disclaimer: Opinions posted on Free Republic are those of the individual posters and do not necessarily represent the opinion of Free Republic or its management. All materials posted herein are protected by copyright law and the exemption for fair use of copyrighted works.