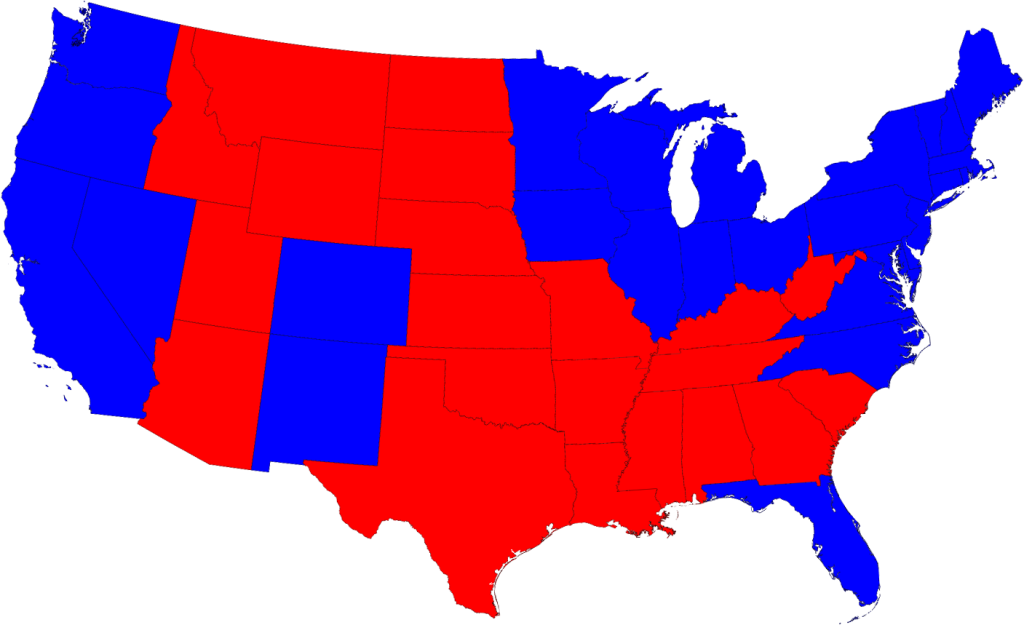
Minus HI and AK...
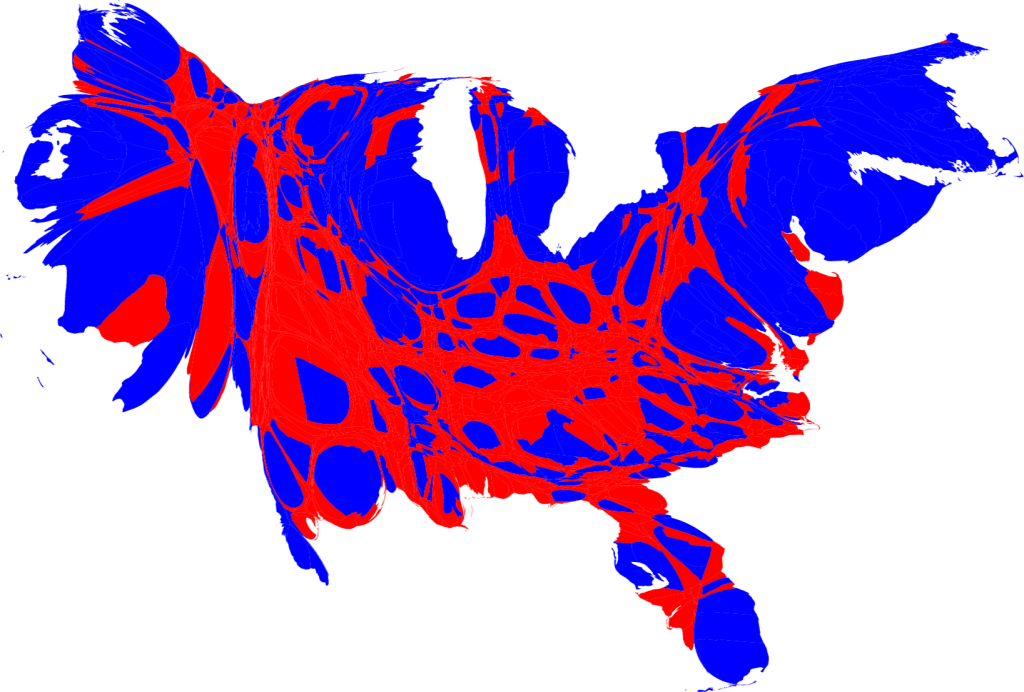
Now let's take your county map and put it on a cartogram which would look like this.


Minus HI and AK...

Can’t be right, the Ohio portion doesn’t come close to the map I saw. And acres don’t vote, people do.
Can’t be right, the Ohio portion doesn’t come close to the map I saw. And acres don’t vote, people do.
Wow - Oklahoma and Alaska - completely red.
That map makes no difference. It will change dramatically once B.O gives 30 million illegal aliens the right to vote.
The blue cancer is spreading.
You can see it radiating outward.
The bottom red county in Delaware is mine. There is still is some sanity here.
The top county is the smallest but the most populous—their the idiots who keep voting for Biden.
Does anyone have an update state map for the 2008 election?
You DO realize, of course, that the people in the smaller blue regions number as many people as the larger red regions, right? So, BY THE NUMBERS we are split almost 50.50 red and blue?
Territory does not equal votes.
The problem with that map is that it doesn’t take into account the relative strengths of the various areas in the U.S. in terms of the electoral votes and/or the popular votes...
See the following — and then you can see how “squeezed” the red areas are —
http://www-personal.umich.edu/~mejn/election/2008/
http://www.wmhartnett.com/2008/11/10/county-level-2008-election-results-as-3d-maps/