Skip to comments.
La Niña is expected to continue through the Northern Hemisphere spring 2008.
NOAA Climate Prediction Center ^
| 7 February 2008
| Climate Prediction Center Internet Team
Posted on 02/08/2008 3:25:36 AM PST by justa-hairyape
EL NIÑO/SOUTHERN OSCILLATION (ENSO)
DIAGNOSTIC DISCUSSION
issued by
CLIMATE PREDICTION CENTER/NCEP
7 February 2008
Synopsis: La Niña is expected to continue through the Northern Hemisphere spring 2008.
Current atmospheric and oceanic conditions indicate that La Niña has continued to strengthen in
the tropical Pacific. By the end of January 2008, equatorial SST anomalies were more than 2.0°C
below average across parts of the central and east-central equatorial Pacific.
Other than the far eastern Niño-1+2 region, the magnitude of the cold anomalies in the Niño region
indices increased during the past month with the latest weekly values near -1.5°C.
The upper-ocean heat content (average temperatures in the upper 300m of the oceans) also decreased
further during January (figure 3), and negative subsurface anomalies between -2°C to -5°C expanded
westward towards the Date Line (figure 4).
Consistent with these oceanic conditions, stronger-than-average low-level easterly and upper-level
westerly winds persisted across the central equatorial Pacific, convection remained suppressed
throughout the central equatorial Pacific, and enhanced convection covered the far western Pacific.
Collectively, these oceanic and atmospheric conditions are similar to those accompanying the last
strong La Niña episode in 1998-2000.
The recent dynamical and statistical SST forecasts for the Niño 3.4 region indicate a moderate-to-strong
La Niña through the rest of the Northern Hemisphere winter, with the likely continuation of a weaker
La Niña through April-May-June.
Thereafter, there is considerable spread in the models, with approximately one-half indicating La Niña
could continue well into the Northern Hemisphere summer. Current atmospheric and oceanic conditions
and recent trends are consistent with the likely continuation of La Niña through the Northern
Hemisphere spring 2008.
Expected La Niña impacts during February-April include a continuation of above-average precipitation
over Indonesia and below-average precipitation over the central equatorial Pacific. For the contiguous
United States, potential impacts include above-average precipitation in the Northern Rockies, the
Pacific Northwest, and the Ohio and Tennessee Valleys. Below-average precipitation is expected across
the South, particularly in the southeastern states.
This discussion is a consolidated effort of NOAA and its funded institutions. Oceanic and atmospheric
conditions are updated weekly on the Climate Prediction Center web site
(El Niño/La Niña Current Conditions and Expert Discussions).
Forecasts for the evolution of El Niño/La Niña are updated monthly in the Forecast Forum
section of CPC's Climate Diagnostics Bulletin. The next ENSO Diagnostics
Discussion is scheduled for 6 March 2008. To receive an e-mail notification when
the monthly ENSO Diagnostic Discussions are released, please send an e-mail message to:
ncep.list.enso-update@noaa.gov.
Climate Prediction Center
National Centers for Environmental Prediction
NOAA/National Weather Service
Camp Springs, MD 20746-4304
TOPICS: News/Current Events; Technical
KEYWORDS: agw; cold; globalcooling; globalwarming; lanina; noaa; weather
Navigation: use the links below to view more comments.
first previous 1-20, 21-40, 41-60, 61-80, 81-93 next last
To: JustDoItAlways
Awesome animations, thanks.
Looking at past La Ninas, specifically the one that followed the 1997/1998 El Nino and lasted from July 1998 to June 2000, there were periods where the intensity weakened and then strengthened again.
To: justa-hairyape; ExGeeEye
>> Don’t know about 1994, but your anecdotal observations correlate with the sunspot cycle in the following manner. Your cold periods occur as the sunspot cycle is increasing and your warm periods occur as the sunspot is decreasing. Again, will have to check 1944 later. This makes some sense since there will be an inherent delay and we are talking about sun intensity over time. Also the Earths vast Oceans act as temp buffers. Our Atmosphere also has some minor metrics involved. The problem right now is with the 1998 measured temperature peak. That was a couple of years later then your anecdotal observations, but statistically close. <<
Not even close. exgeeeye is referring to a 34-year cycle; the sunspots are an 11-year cycle. Actually, exgeeeye, what I’ve seen in the temperature graphs is closer to a 65-year cycle. Down from 1880 to 1910, up until 1944, down until the mid seventies, up until 2005. Is that a cycle? Does it negate anthropogenic global warming if the 2005 peak* was a quarter of a degree warmer than the 1944 peak? Or is that instrumentation error caused by local warming at the reading sites?
(* The warmest year was 1998, but that seems aberrational, not part of the larger trend.)
62
posted on
02/14/2008 6:10:02 AM PST
by
dangus
To: Perchant; justa-hairyape; cogitator
La Nina is a convenient “weather god” used by the climate hoaxers to account for their missing warming. Not exactly. La Nina is a real phenomenon, which is really happening and which really cools the equatorial Pacific Ocean enough to impact global average temperatures significantly.
But there is a cooling event happening broader than the La Nina. Last year, there was a moderately strong El Nino (a warming event) which should have shattered 1998's record for warmest year yet... and didn't. Now, we're getting a moderate La Nina, which is plunging multi-year trend lines way, way down.
The upshot is that La Nina is cooling us off, but doesn't explain why it's *also* cool in a belt circling the Earth at about the Antartic circle, why it's been cool in the North Pacific, why the temperatures in the Indian Ocean have suddenly plunged, etc.
Overall, this El-Nino/La-Nina cycle is producing temperatures very similar to the 1998-2000 cycle, which means that after two decades (mid 1970s to late 1990s) of significant warming, we've had a decade of temperature stability. (Probably, if you remove the El-Nino/La-Nina cycles, you'd get a peak in 2005.)
This decade of temperature stability doesn't negate global warming. But global warming as we saw in the 20th century was pretty damned harmless. Ooh, whoopee! 2/3rds of a degree! But the pace in the 1990s would be warming us up maybe two degrees in the 21st century... still pretty damned harmless.
The hysteria was that global warming had accelerated, and would continue to do so. Some were making predictions of up to ten degrees Celsius. While this would hardly mean planetary extinction and it's only about 1/10th of what it would take to melt Antarctica in 10,000 years, it'd make life miserable.
The notion of an acceleration of global warming is thoroughly debunked. It's true we haven't yet established a new era of global cooling, which seems to be the straw man Cogitator is arguing against. But its absurd to cling to predictions made based on 2005 data:
Note to Cogitator:
What's irritating isn't that you attempt to rebut my assertions: I'm glad for that, since it *does* point me towards more information, more arguments, etc. What's irritating is that you don't try to arrive at a rational middle-ground. It's like you are asserting, "One of us is full of ****. Let the reader decide which one." Frankly, given our audience, I think that gives me an upper hand. (You'd win hands-down at DU or DailyKOS... and that's meant as a comment about our audiences, not an ad hominem) It's like there's no sense you're trying to reason with me, but rather you're trying to shout me down with the party line. Can you see how the fact that there is a La Nino (which I have persistently acknowledged) doesn't alter the larger argument I'm making?
63
posted on
02/14/2008 6:42:28 AM PST
by
dangus
To: dangus; Perchant; justa-hairyape; cogitator
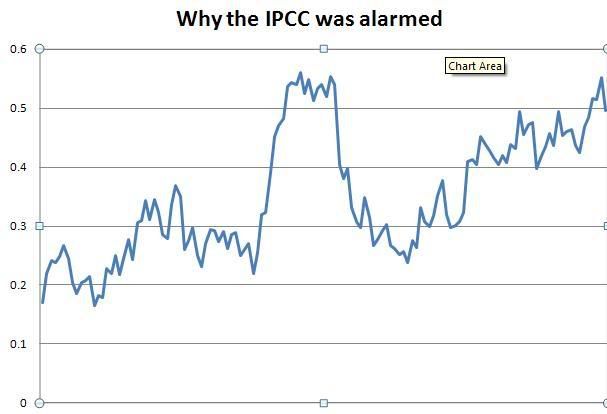
OOps... I just did what I was accusing Cogitator of... not explaining my charts. I forgot that they were in the text, not the graphics.
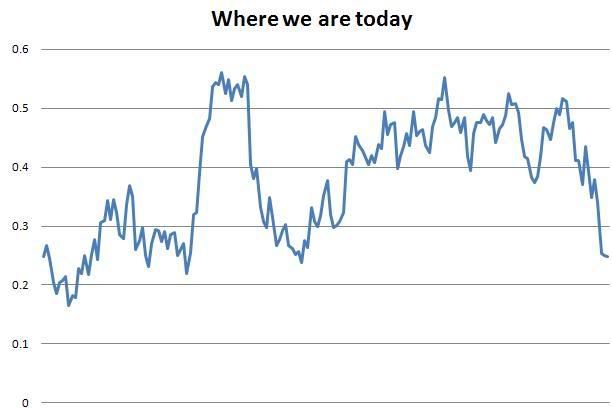
The first chart is of global surface temperatures, based on land-based measurements, between 1993 and 2003, inclusive. The numbers on the X axis are the deviations, in degrees Celsius, from the average of all months between 1870 and 2008. The second chart is similar, but contains measurements from 1993 through January, 2008.
64
posted on
02/14/2008 6:48:11 AM PST
by
dangus
To: dangus; cogitator

Here's a longer-term chart of global temperature trends, from 1880 to 2008. The pink line is a trend line of about one degree per century. The two red lines are of about two degrees per century. The horizontal lines are .2 degrees per century. The data is NCDC data using land-based instruments of ocean and land temperatures. You can see how we'de need one hell of a record-breaking heat wave just to get back to the red line.
65
posted on
02/14/2008 7:07:56 AM PST
by
dangus
To: dangus; cogitator
Oops! Take two:
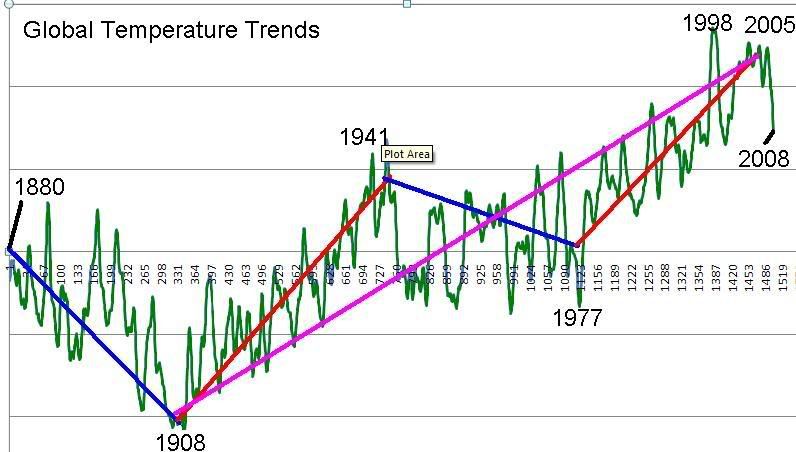
Here's a longer-term chart of global temperature trends, from 1880 to 2008. The pink line is a trend line of about one degree per century. The two red lines are of about two degrees per century. The horizontal lines are .2 degrees per century. The data is NCDC data using land-based instruments of ocean and land temperatures. You can see how we'de need one hell of a record-breaking heat surge just to get back to the red line, let alone to demonstrate any acceleration of the red line.
66
posted on
02/14/2008 7:11:43 AM PST
by
dangus
To: dangus
Last year, there was a moderately strong El Nino (a warming event) which should have shattered 1998's record for warmest year yet... and didn't.I don't know where you're getting this; 2007's El Nino was considered weak. It never really got going and faded by October. Strong El Nino events go through the winter. This one got replaced by La Nina.
but doesn't explain why it's *also* cool in a belt circling the Earth at about the Antartic circle, why it's been cool in the North Pacific, why the temperatures in the Indian Ocean have suddenly plunged, etc.
If you look at today's SST anomaly plot in the other thread, the SST cool anomaly in the SH is mostly gone, the North Pacific is bifurcated, and the Indian Ocean is cool, which appears to be a teleconnection of La Nina.
But the pace in the 1990s would be warming us up maybe two degrees in the 21st century.
Projections of global water resources based on just that 2 C warming aren't exactly harmless.
What's irritating is that you don't try to arrive at a rational middle-ground.
What do you think a rational middle ground is? I don't care what the "audience" is -- I care about accuracy. And so should the audience. If you think that telling the "audience" that a couple of cool years mean that there's nothing to worry about, that's not accurate. But if you think that's what the "audience" wants to hear, then keep up the good work.
To: dangus
Nice plot. Considering that 2008 is 1.5 months old, I think that your projection is premature, though. I expect the La Nina will fade by May-June. Then we'll see what happens in the NH summer.
Here's a fun prediction: based on nothing but guessing that La Nina will end as noted above, and thinking that the rest of the year will have "normal" (for the 1990-2010 period) temperatures, I predict that at the end of the year, the 2008 global average annual temperature will rank 5th all-time with GISS, 14th all-time with NOAA, and 12th all-time with Hadley Centre UK. Write it down and tell me how close I am next January.
To: dangus
"Collectively, these oceanic and atmospheric conditions are similar to those accompanying the last strong La Niña episode in 1998-2000."I think you said in the other thread that this La Nina is similar to 1995-1996. That's not what this article says, is it?
To: Islander7
January of 1962 was the last time snow fell in Los Angeles.
To: justa-hairyape
So, are we all going to die, or what?
71
posted on
02/14/2008 7:59:29 AM PST
by
Nachoman
(My guns and my ammo, they comfort me.)
To: cogitator
>> Nice plot. Considering that 2008 is 1.5 months old, I think that your projection is premature, though. <<
That’s not a projection. It’s a monthly chart, not a yearly one.
>> I expect the La Nina will fade by May-June. <<
Well, since I’m reporting it’s already dissipating; I’ll concur.
>> I predict that at the end of the year, the 2008 global average annual temperature will rank ... 14th all-time with NOAA, ... Write it down and tell me how close I am next January. <<
I’ll even concur with you on that. In fact, I expect it’ll be higher (lower ordinal, like maybe 10th? 8th?). 14th hottest would absolutely prove my assertion. Don’t forget that my original post only asserted a reversion to 1994 temperatures. 14th hottest would pretty much mean we’re back to 1994, a stunning reversion if it held for the entire year.
72
posted on
02/14/2008 8:07:26 AM PST
by
dangus
To: cogitator
>> I think you said in the other thread that this La Nina is similar to 1995-1996. <<
YOU supplied a chart comparing it to the 1995-1996 La Nina.
>> “Collectively, these oceanic and atmospheric conditions are similar to those accompanying the last strong La Niña episode in 1998-2000.” <<
In what ways are they similar? In what ways are they not similar to the four La Ninas we’ve had since 1998-2000? The 1998-2000 only returned ocean temperatures to what they were immediately before the 1998 El Nino. There was NO decrease in ocean temperatures at all from 1997. The current cool spell is wiping out 14 years of warming. That’s a monumental difference. So, if all else is equal (if “oceanic and atmospheric conditions are similar to those accomanying the last strong La Nina in 1998-2000”) doesn’t that mean that the current cool spell is not at all explained by the current La Nina?
In fact, if the 2008 temperatures are the 14th coolest on record (meaning roughly equal to 1994), doesn’t that mean the Earth hasn’t warmed a bit since 1994? (or at least since the comparable La Nina of 1999?)
73
posted on
02/14/2008 8:39:33 AM PST
by
dangus
To: dangus
14th hottest would absolutely prove my assertion. And when the next year with a substantial El Nino ranks first in the assessments of all three groups, what will that do to your assertion?
To: dangus
In what ways are they similar?Ask NOAA. But... I would guess that strong La Nina patterns are similar over several events.
The current cool spell is wiping out 14 years of warming.
That's a fallacy. What you're seeing is what is commonly called "interannual variability" -- El Nino and La Nina are the biggest interannual variants in the ocean/atmosphere climate system. This will be a cool year (probably), but the underlying warming trend is still there. Which means that global temperatures won't go as low this year as compared to a similarly-sized La Nina happening a decade ago.
In fact, if the 2008 temperatures are the 14th coolest on record (meaning roughly equal to 1994), doesn’t that mean the Earth hasn’t warmed a bit since 1994? (or at least since the comparable La Nina of 1999?)
One year doesn't make a trend. Meaning that if you averaged global temperatures from 1992-1997 and 2002-2007 (which excludes 1998), then the 2002-2007 period should be ~0.2 C warmer than 1992-1997.
To: dangus
Our universe is complex. There may be more than one cycle— perhaps even more than 3 or 4— at work simultaneously. This might explain why some “ice ages” are very long and others not so much.
At any rate I don’t think parking the SUVs will have a noticeable effect.
76
posted on
02/14/2008 1:02:45 PM PST
by
ExGeeEye
(NIE or no NIE, I've been waiting since 11/04/79 to do something about Iran.)
To: cogitator
I predict that at the end of the year, the 2008 global average annual temperature will rank 5th all-time with GISS It will rank where the official data collectors and instrument calibrators want it to rank because there is no way to challenge their findings.
If 2008 ends up the coldest year in 200 years, they will say it was amongst the top warmest. They have to claim this or the party is over for thousands of climate change scientists and they would soon be flipping burgers at Wendys.
77
posted on
02/14/2008 3:40:00 PM PST
by
Perchant
To: dangus
Not even close. exgeeeye is referring to a 34-year cycle; the sunspots are an 11-year cycle. The sunspot cycle length does have a minor variance. What I am more interesting in is correlating his anecdotal observations to the phase of the cycle. The following two observations of his were what I was referring too.
...remember the vicious winter of 1978-79. O'Hare was closed for days (at a time? or several times?). There were so many snow days at my school that there was talk of lengthening the school year (they planned for a few snow days, but they were used up quickly). It was plain nasty....17 years before was 1961, three years before I was born, so I had to ask around. To give people a reference point, I brought up the start of the Kennedy Administration. Almost uniformly, people told me it was a gorgeous year weatherwise, the sun shone brilliantly upon Inauguration Day, etc. etc....
1978-1979 (rising phase of solar sunspot activity curve)
1961 (falling phase of solar sunspot activity curve)
Actually, exgeeeye, what I’ve seen in the temperature graphs is closer to a 65-year cycle. Down from 1880 to 1910, up until 1944, down until the mid seventies, up until 2005.
Obviously we are dealing with multiple cycles and multiple causation factors. Trying to separate their affects is what makes this process so difficult.
To: cogitator
I don't know where you're getting this; 2007's El Nino was considered weak. It never really got going and faded by October. Strong El Nino events go through the winter. This one got replaced by La Nina. Here is the data from NWS Climate Prediction Center (Changes to the Oceanic Nino Index (ONI)
August 2006 + 0.5
September 2006 + 0.7
October 2006 + 0.9
November 2006 + 1.2
December 2006 + 1.1
January 2007 + 0.8
February 2007 + 0.4
March 2007 +0.1
April 2007 -0.1
To: SoCal Pubbie
January of 1962 was the last time snow fell in Los Angeles. That depends on what you consider Los Angeles. Now if you refer to Greater Los Angeles, including Rancho Cucamonga, we had snow one day last winter and thursday morning people saw flakes falling in Fontana and nearby on the 10 freeway.
Navigation: use the links below to view more comments.
first previous 1-20, 21-40, 41-60, 61-80, 81-93 next last
Disclaimer:
Opinions posted on Free Republic are those of the individual
posters and do not necessarily represent the opinion of Free Republic or its
management. All materials posted herein are protected by copyright law and the
exemption for fair use of copyrighted works.
FreeRepublic.com is powered by software copyright 2000-2008 John Robinson