Free Republic
Browse · Search
News/Activism
Topics · Post Article

To: Teacher317
Now if you could also post a map with violent crime rates so that we could compare it with the 2006 map.
43 posted on 03/29/2007 2:34:45 PM PDT by fireforeffect (A kind word and a 2x4, gets you more than just a kind word.)
[ Post Reply | Private Reply | To 9 | View Replies ]


To: fireforeffect
Honestly, I think that it would not be as helpful as we would assume. State-wide crime rates are just too wide-ranging. A county-by-county map, or even a city map, would be more informative, and contrast it with a map of those cities that have stricter gun laws.

But really, everyone knows what the map will look like. Most cities have far more violent crime, and higher violent crime rates, than suburban and rural areas. There will be a few variations, of course, but the pattern will dominate the map.

Sometimes I wonder if we just might need different sets of rules for urban vs suburban areas. (Recall that America's largest city in 1776 was Philadelphia... at 50,000 people.)

79 posted on 03/30/2007 5:27:42 AM PDT by Teacher317 (Are you familiar with the writings of Shan Yu?)
[ Post Reply | Private Reply | To 43 | View Replies ]

To: fireforeffect
How's this?

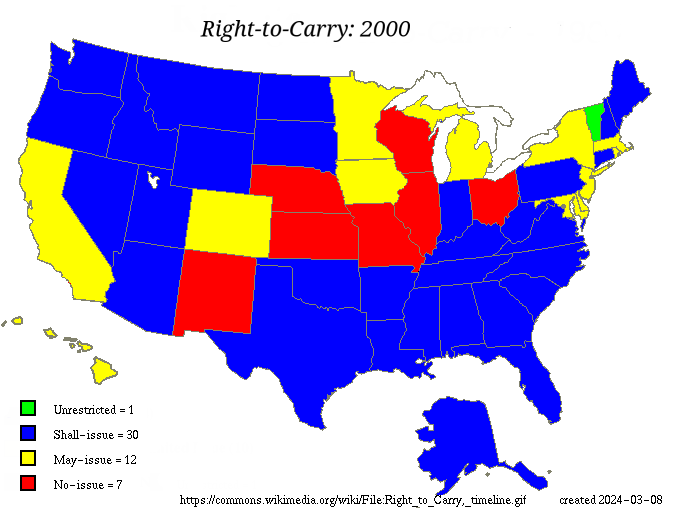
Maryland, Delaware, DC, Illinois, New Mexico... half of the worst areas have the most restrictions for 1999-2000

Kansas is the only one of the best areas without "Shall-issue" or no restrictions. Coincidence only, of course.

83 posted on 03/30/2007 7:19:40 AM PDT by Teacher317 (Are you familiar with the writings of Shan Yu?)
[ Post Reply | Private Reply | To 43 | View Replies ]

Free Republic
Browse · Search
News/Activism
Topics · Post Article


FreeRepublic, LLC, PO BOX 9771, FRESNO, CA 93794
FreeRepublic.com is powered by software copyright 2000-2008 John Robinson