Skip to comments.
Look to mars for the truth on global warming (mini ice-ace predicted)
Financial Post ^
| Jan 26, 2007
| Lawrence Soloman
Posted on 01/28/2007 8:59:27 PM PST by caveat emptor
Look to Mars for the truth on global warming
...."It is no secret that increased solar irradiance warms Earth's oceans, which then triggers the emission of large amounts of carbon dioxide into the atmosphere. So the common view that man's industrial activity is a deciding factor in global warming has emerged from a misinterpretation of cause and effect relations."
Dr. Abdussamatov goes further, debunking the very notion of a greenhouse effect. "Ascribing 'greenhouse' effect properties to the Earth's atmosphere is not scientifically substantiated," he maintains. "Heated greenhouse gases, which become lighter as a result of expansion, ascend to the atmosphere only to give the absorbed heat away.".....
(Excerpt) Read more at canada.com ...
TOPICS: Culture/Society; News/Current Events
KEYWORDS: astrometry; astrometryproject; climatechange; globalcooling; globalwarming; globalwhat; iceage
Navigation: use the links below to view more comments.
first previous 1-20, 21-40, 41-57 next last
To: Buckhead
21
posted on
01/29/2007 5:11:50 AM PST
by
Laserman
To: caveat emptor
I recall reading somewhere that Pluto's atmosphere had increased or expanded due to solar influence..
If there is an actual causation / correlation effect, it reaches all the way to the edges of the solar system..
It will be interesting to see if the russian's theories can be validated...
22
posted on
01/29/2007 5:30:12 AM PST
by
Drammach
( Tolerance is not simply making allowances......It is also setting limits,,,)
To: Buckhead
"paleoclimate data temperature increases *preceded* increases in CO2 by 800-1200 years"
I have noticed the same thing on graphs of temp and Co2 vs time.
I have often wondered why no one mentions this!
23
posted on
01/29/2007 6:56:36 AM PST
by
EEDUDE
To: caveat emptor
Global warming extends to Mars, where the polar ice cap is shrinking, where deep gullies in the landscape are now laid bare, and where the climate is the warmest it has been in decades or centuries. Al Gore was right (read my tagline)!
24
posted on
01/29/2007 6:57:27 AM PST
by
A. Pole
("We are the most powerful force of nature. We are changing the relationship between the Earth and th)
25
posted on
01/29/2007 6:58:45 AM PST
by
A. Pole
(Gore:We are the most powerful force of nature.We are changing the relationship between Earth and Sun)
To: lostlakehiker
The sun isn't getting that much hotter on the time scale of a century or so. And we do have ways to measure it. Increased solar output doesn't begin to explain the climate change we're seeing.
Ahmmm, I presume you apparently are overlooking the effect of variation of the solar helio magnetic field during high activity solar cycles.
Irradiance is not the issue, reduction of cloud cover as it allows more visible light to the surface is. As Earth's atmosphere is shielded from ionizing cosmic radiation by the augmentation of the geo-magnetic field during high solar activity phases there is less cloud cover and higher surface temperatures due to greater solar radiant flux allowed down to the surface rather than reflected away back into space.
http://isccp.giss.nasa.gov/zD2BASICS/B8glbp.anomdevs.jpg


Blue semicircles mark La Ninas, red rectangles mark El Ninos, and green triangles mark large volcanic eruptions.
The marked volcanic eruptions are Surstey 1963, El ChiChon 1982, and Pinatubo 1997.
New Scientist - Hyperactive sun comes out in spots

http://www.sciencebits.com/CosmicRaysClimate
Clouds have been observed from space since the beginning of the 1980's. By the mid 1990's, enough cloud data accumulated to provide empirical evidence for a solar/cloud-cover link. Without the satellite data, it hard or probably impossible to get statistically meaningful results because of the large systematic errors plaguing ground based observations. Using the satellite data, Henrik Svensmark of the Danish National Space Center in Copenhagen has shown that cloud cover varies in sync with the variable cosmic ray flux reaching the Earth. Over the relevant time scale, the largest variations arise from the 11-yr solar cycle, and indeed, this cloud cover seemed to follow the cycle and a half of cosmic ray flux modulation. Later, Henrik Svensmark and his colleague Nigel Marsh, have shown that the correlation is primarily with low altitude cloud cover. This can be seen in fig. 3.
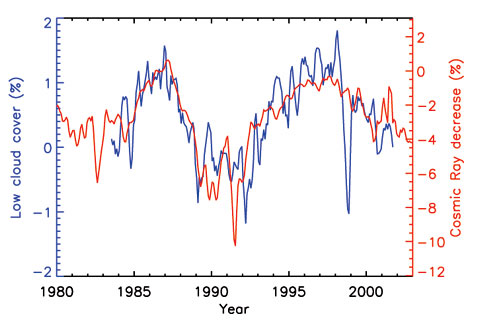
Figure 3: The correlation between cosmic ray flux (orange) as measured in Neutron count monitors in low magnetic latitudes, and the low altitude cloud cover (blue) using ISCCP satellite data set, following Marsh & Svensmark, 2003.
The solar-activity – cosmic-ray-flux – cloud-cover correlation is quite apparent. It was in fact sought for by Henrik Svensmrk, based on theoretical considerations. However, by itself it cannot be used to prove the cosmic ray climate connection. The reason is that we cannot exclude the possibility that solar activity modulates the cosmic ray flux and independently climate, without any casual link between the latter two. There is however separate proof that a casual link exists between cosmic rays and climate, and independently that cosmic rays left a fingerprint in the observed cloud cover variations.
The real concern should be about where we go from here as the sun comes of its peak in activity:
NASA - Long Range Solar Forecast

And may already be showing up in falling ocean temperatures since ~2003
Sea Change in Global Warming
Mystery of Missing Heat: Upper Ocean has cooled slightly in recent years.
Between 2003 and 2005, the top layers of the world's oceans cooled slightly, but scientists aren't sure where the heat went.
According to climate data gathered worldwide, 2003, 2004, and 2005 are three of the five warmest years since reliable record keeping of global air temperatures began more than a century ago. However, oceanographic surveys suggest that on average, the upper 750 meters of the world's ice-free oceans cooled about 0.03°C during that 3-year period.
26
posted on
01/29/2007 7:07:33 AM PST
by
ancient_geezer
(Don't reform it, Replace it.)
To: cogitator; All
It is no secret that increased solar irradiance warms Earth's oceans, which then triggers the emission of large amounts of carbon dioxide into the atmosphere.That fact is easily corroborated, as in comment# 13.
27
posted on
01/29/2007 8:52:47 AM PST
by
neverdem
(May you be in heaven a half hour before the devil knows that you're dead.)
To: neverdem
That fact is easily corroborated, as in comment# 13.And subsequent warming after the Milankovitch cycle-initiated increase in insloation is caused by positive feedback from the increased CO2 concentration in the atmosphere, because the amount that solar insolation changes due to Milankovitch cycles is vastly insufficient to warm the planet as much as it warms in a glacial-interglacial transition.*
* A fact that is lost on 95% of the people who post that the lag of CO2 during glacial-interglacial transitions refutes the causation of the temperature increase attributed to increasing atmospheric CO2 now.
Supporting resources:
What caused Glacial-Interglacial CO2 Change? (This is a very good scientifically-oriented Powerpoint presentation)
Surface Temperature, Carbon Dioxide and Methane: The Past, Present and Likely Trajectory of Three Key Indicators of Climate Change (PDF)
"During the past, at the scale of glacialinterglacial cycles, CO2 increases have been activated by orbital forcing of the climate system but have thereafter, played a major role in strongly amplifying, together with the collapse of the northern ice sheets, the amplitude of the climate warming. The temperature response of these past CO2 changes appears to remain the same over time, whatever the conditions of the climate change are. It therefore, gives the research community more confidence in the CO2temperatue proportionality observed during the past, when making projections of future global warming."
Feedback Loops in Global Climate Change Point to a Very Hot 21st Century
"Using as a source the Vostok ice core, which provides information about glacial-interglacial cycles over hundreds of thousands of years, the researchers were able to estimate the amounts of carbon dioxide and methane, two of the principal greenhouse gases, that were released into the atmosphere in response to past global warming trends. Combining their estimates with standard climate model assumptions, they calculated how much these rising concentration levels caused global temperatures to climb, further increasing carbon dioxide and methane emissions, and so on."
The same article contains this "smoking gun" paragraph:
"In examining data recorded in the Vostok ice core, scientists have known that cyclic variations in the amount of sunlight reaching the earth trigger glacial-interglacial cycles. However, the magnitude of warming and cooling temperatures cannot be explained by variations in sunlight alone. Instead, large rises in temperatures are more the result of strong upsurges in atmospheric carbon dioxide and methane concentrations set-off by the initial warming.
(I didn't write that. But it's exactly what I've said, and repeated, numerous, numerous times on FR. The lag of CO2 in ice cores is only for the initial warming triggered by Milankovitch cycle forcing. Subsquent warming is due to the positive feedback of rising CO2 (and also CH4) concentrations in the atmosphere.
I wish there was one simple diagram that could demonstrate this very simple point.
To: A. Pole
fixed tagline
I thought the omission was deliberate.

Let your imagination soar!
To: Laserman
"researchers are more concerned about getting their next grant check than about being accurate. Their principles are being "bought" by a politically motivated support structure."
My contention all along. Follow the money..
Grant money for the "man made global warming" crowd is
probably the biggest cash cow of grants in history.
30
posted on
01/29/2007 10:11:45 AM PST
by
AlexW
(Reporting from Bratislava, Slovakia)
To: cogitator; neverdem
the amount that solar insolation changes due to Milankovitch cycles is vastly insufficient to warm the planet as much as it warms in a glacial-interglacial transition.
Which is why others are out looking for more direct connections than eccentricity changes, which even Milankovich had serious doubts about considering is weakness.
Ever since Wallace Broeker(1992) presented the Devil's hole data, and later Richard Muller challenged Milokovich several years ago other investigators have been encouraged to take second and third looks at this fragile reed of climate theory.
The sun and science marches onward not standing still for even anthropogenic global warming theory.
Solar Resonant Diffusion Waves as a Driver of Terrestrial Climate Change
Authors: Robert Ehrlich
Comments: in press with The Journal of Atmospheric and Solr Terrestrial Physics
http://www.freerepublic.com/focus/f-news/1775321/posts?page=26#26
A theory is described based on resonant thermal diffusion waves in the sun that appears to explain many details of the paleotemperature record for the last 5.3 million years. These include the observed periodicities, the relative strengths of each observed cycle, and the sudden emergence in time for the 100 thousand year cycle. Other prior work suggesting a link between terrestrial paleoclimate and solar luminosity variations has not provided any specific mechanism. The particular mechanism described here has been demonstrated empirically, although not previously invoked in the solar context. The theory also lacks most of the problems associated with Milankovitch cycles.
31
posted on
01/29/2007 11:22:04 AM PST
by
ancient_geezer
(Don't reform it, Replace it.)
To: cogitator
32
posted on
01/29/2007 11:24:57 AM PST
by
ancient_geezer
(Don't reform it, Replace it.)
To: ancient_geezer
AG, even it it was a driver, is he suggesting it's enough for the total range of glacial-interglacial temperatures?
To: ancient_geezer; neverdem
AG, even it it was a driver, is he suggesting it's enough for the total range of glacial-interglacial temperatures?I perused the paper, quickly, and perhaps he is. Well, his paper has been tossed on the grill -- we'll have to see how well it cooks. Meanwhile, I'll continue to indicate what the climate science community has stated regarding this particular subtopic. Extraordinary claims require extraordinary evidence, y'know.
To: cogitator
Read the pdf, its only 250Kbytes or so and free download on the webpage the link takes you too.
This paper is dealing with the mechanics of the fusion process apparently driving things through resonant core temperature flucuations.
It currently remains to the astronomers to look for stars with the characteristics of the mode described and obtain data on which to bound the magnitude of these 100 & 40kyr cycles.
Key is that observations of Sol like stars show more than enough irradiance variability to account for much greater magnitude irradiance forcing than Milankovich's insolation parameter has ever been able to account for. I would say this mechanism has strong potential for providing the necessary delta in flux a the sun's surface.
35
posted on
01/29/2007 11:51:39 AM PST
by
ancient_geezer
(Don't reform it, Replace it.)
To: cogitator
Extraordinary claims require extraordinary evidence, y'know.
Indeed, especially where variation in eccentricity is concerned which is a very weak and speculative link indeed and always has been. That is why so many alternative being offered trying to account for the energy necessary to drive the climate changes found in the paleo record.
36
posted on
01/29/2007 11:56:43 AM PST
by
ancient_geezer
(Don't reform it, Replace it.)
To: cogitator
Here's what looks to be an interesting one for you.
Radiative forcing by well-mixed greenhouse gases:
Estimates from climate models in the
Intergovernmental Panel on Climate Change
(IPCC) Fourth Assessment Report (AR4)
http://www.agu.org/pubs/crossref/2006.../2005JD006713.shtml
Collins, W.D., et al. J. Geophys. Res. 111, D14317, doi:10.1029/2005JD006713.
The radiative effects from increased concentrations of well-mixed greenhouse gases (WMGHGs) represent the most significant and best understood anthropogenic forcing of the climate system. The most comprehensive tools for simulating past and future climates influenced by WMGHGs are fully coupled atmosphere-ocean general circulation models (AOGCMs). Because of the importance of WMGHGs as forcing agents it is essential that AOGCMs compute the radiative forcing by these gases as accurately as possible. We present the results of a radiative transfer model intercomparison between the forcings computed by the radiative parameterizations of AOGCMs and by benchmark line-by-line (LBL) codes. The comparison is focused on forcing by CO2, CH4, N2O, CFC-11, CFC-12, and the increased H2O expected in warmer climates. The models included in the intercomparison include several LBL codes and most of the global models submitted to the Intergovernmental Panel on Climate Change (IPCC) Fourth Assessment Report (AR4). In general, the LBL models are in excellent agreement with each other. However, in many cases, there are substantial discrepancies among the AOGCMs and between the AOGCMs and LBL codes. In some cases this is because the AOGCMs neglect particular absorbers, in particular the near-infrared effects of CH4 and N2O, while in others it is due to the methods for modeling the radiative processes. The biases in the AOGCM forcings are generally largest at the surface level. We quantify these differences and discuss the implications for interpreting variations in forcing and response across the multimodel ensemble of AOGCM simulations assembled for the IPCC AR4.
Trying to decide whether or not to spring for the bucks to get a copy of this one presuming I don't find it on the internet somewhere.
Judging from the abstract it should be filled with info that could provide answers about many facits of current climate models. I'm especially curious concering the magnitudes they assign to the role of water vapor vs CO2 and how well it stands up to current observations of the water vapor column in the atmosphere put out by NAVP and others.
37
posted on
01/29/2007 12:11:17 PM PST
by
ancient_geezer
(Don't reform it, Replace it.)
To: ancient_geezer
Have you read Crowley 2002, "Cycles, cycles, everywhere"? I can't find a free copy online.
To: cogitator
Only place I know where a copy would is on the AAAS website on the internet but it costs real dollars over there.
Luckily I have a subscription and a link to the article.
http://www.sciencemag.org/cgi/content/full/295/5559/1473
Can't pass the whole article out without violating my subscription agreement, but I suppose it wouldn't stretch fair use rules too much to answer specific questions with a quote or two as a teaser ;O).
39
posted on
01/29/2007 12:59:48 PM PST
by
ancient_geezer
(Don't reform it, Replace it.)
To: ancient_geezer
That's fine, I have a print copy (not with me, though). I just wondered if you had read it. My basic memory was that although Milankovitch theory had a lot in favor of it, not everything in paleoclimate correlated with it; i.e., it still explains the bulk of the data but doesn't nail all the details.
Navigation: use the links below to view more comments.
first previous 1-20, 21-40, 41-57 next last
Disclaimer:
Opinions posted on Free Republic are those of the individual
posters and do not necessarily represent the opinion of Free Republic or its
management. All materials posted herein are protected by copyright law and the
exemption for fair use of copyrighted works.
FreeRepublic.com is powered by software copyright 2000-2008 John Robinson