Posted on 01/13/2007 6:44:00 AM PST by drellberg
"In 15 years, scientists say, the snows of Kilimanjaro will simply melt away. ... Kilimanjaro is not the only place that is threatened. Glaciers and polar ice are melting. Coral reefs are dying as the seas get too warm. Lakes and rivers in colder climates are freezing later and thawing earlier each year, disrupting the life cycles of native plants and animals. What is causing this breakdown in nature?
(Excerpt) Read more at timeforkids.com ...
[With 6 billion people it would seem that wasting a few is very little damage for a battle as serious as this.]
Are you volunteering to be wasted?
Some studies suggest there is an over-supply of Old Professors and that a few should be culled from the herd.
"Can't have that. Not good for business."
;-)
Thank you for the snicker...I needed one today!
>>within the earth's atmosphere.
Should be:
within the earth's surface and atmosphere.
The sun by its self is not warming the earth from -273 deg C to what we have today. I am not disagreeing that the sun warms the earth, but what I am saying is the earth it self is doing most of the warming.
how much? I am not sure.
[The sun by its self is not warming the earth from -273 deg C to what we have today.]
According to the Apollo 14 mission report, the maximum temperature during lunar day is 1360 F and the minimum temperature during lunar night is minus 110 F.
The temperature differential is entirely due to the alternating presence and absence of solar radiation.
+225 degree Fahrenheit during the day is more like it. But you are correct there is a huge difference when there is no atmosphere. All radiated heat makes it to the surface.
I have given up on looking to mainstream reporting of science to rationally discuss global warming. The bias is there, and you can't get around it.
What I have done with friends when it came up was three things, generally couched in humor. First is to claim that I am "pro-global warming." I tell them I don't see a downside.
Second is to repeat the wacko's arguments as they are presented, but in a different context. I may say something like, "You know, if this were 20,000 years ago, you would be asking 'What are we going to do when the glaciers in the midwest melt? What will the mastadons and saber-toothed tigers do?'" That usually gets a laugh and ends the argument, at least giving people something to think about.
Finally, I simply say that I won't seriously consider our influence on global warming significant until someone can tell me why Mars is getting warmer.
Between those three thoughts, as simple as they are, I can usually stop these silly discussions and give people something to think about. Most end up agreeing with me (or at least, considering that point of view).
Seems you're scared of the inevitable curing of human death.
Take a class in sequence stratigraphy: natural cycles
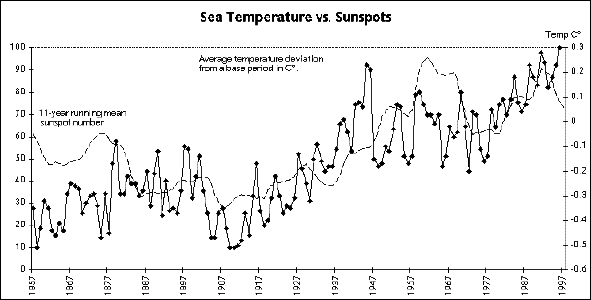
Here is a chart that shows sunspot activity is a one to one correlation with sea temperatures
http://www.qualitydigest.com/april98/assets/images/Sunspot.gif
SPC and Global Warming -- Part II
by Thomas Pyzdek
Last month I presented an SPC analysis of global temperature change that indicated a special cause of variation affecting the temperature data. While theories abound to explain the temperature increase, I will explore only three: urbanization, or the "heat island" effect; carbon dioxide entering the atmosphere due to human activities; and the sunspot cycle.
The heat island effect -- With SPC, it's vital to identify, and compensate for, known sources of variation. In studying global warming, scientists noted that heat generated in cities caused urban meteorological stations to register higher average temperatures than rural stations. Because stations tend to cluster in urban regions, some theorists have argued that the existing data exaggerates the global warming trend.
As with all SPC studies, the measurement system should be evaluated before drawing any conclusions from the data. Surface air and surface sea temperatures are basic weather and climate parameters. One scientific study states, "Errors in surface air temperature trends due to changes of instrumentation, station location and diurnal sampling can be substantial at individual locations. The most serious problem is probably urban heat island effects, which tend to be systematic. ... A more precise test for the United States revealed large differences in certain regions such as Southern California, but averaged over the contiguous United States, the temperature change differed by only 0.1° C."
The data presented in last month's column showed a temperature increase of about 0.64° C, so the urban heat island effect may account for between 15.6 percent and 31.2 percent of the increase. I found no numerical estimates of instrumentation, station location and diurnal sampling errors mentioned in the research.
CO2 released due to human activity -- Global warming is caused by so-called greenhouse gases, which include, besides CO2, water vapor, methane and hydrocarbon. Most of these occur naturally. Figure 1 presents a line chart where the CO2 emitted by human activity is overlaid on the temperature data.
The chart shows an unmistakable increase in CO2. From the end of the last ice age until the mid-19th century, total atmospheric CO2 varied from 260 to 280 parts per million. Since then, the CO2 level has risen to about 340 parts per million. Adding the other greenhouse gases, the total is now about 407 parts per million of greenhouse gases.
Note that between 1867 and 1946, CO2 emissions increased by about 0.9 gigatons while temperature increased by about 0.4° C. Only 15 percent of the total CO2 increase occurred during this period, compared with about two-thirds of the total temperature increase.
Based on the global warming hypothesis, the increase in greenhouse gases since the mid-19th century should have produced a temperature increase of about 1° C to 2° C, but the data show that this hasn't happened. Thus it appears that the link between the level of greenhouse gases and global temperature is poorly understood.
Sunspots -- Dr. George Reid, senior scientist at the National Oceanic and Atmospheric Administration, examined the sea surface temperature record for the last 130 years and found an interesting correlation with the 11-year-running mean sunspot number. Figure 2 shows the correlation between sea temperature and sunspots. Though not identical, the two time series have several features in common, including a prominent minimum during the early 1900s, a steep rise to maximum in the 1950s, a drop in the 1960s and early 1970s, and then a rise that continues to date. While not perfect, the correlation between these two sets of data appears closer than the correlation between CO2 levels and temperature.
A complete analysis of an issue as complicated as global warming would cover many other aspects. However, the point of the past two columns has been to illustrate an approach to investigating any process. The approach can be summarized as follows:
Collect time-ordered data, and plot them on a control chart.
Examine the chart for special-cause data points and patterns.
If special-cause data are found, prepare a list of possible causes.
Collect data on the possible causes, and plot them along with the process data to investigate the correlation graphically.
Put your conclusions to the common-sense test. Are the explanations of the observed associations reasonable?
Take action based on your conclusions.
As social problems become politicized, the truth is often obscured. The same thing happens in business. But people who understand SPC have the tools needed to approach these problems rationally. Try collecting and analyzing data on problems that concern you. You may be surprised by the results.
About the author
Thomas Pyzdek is president and CEO of Quality Publishing. He has written hundreds of articles and papers on quality topics and has authored 13 books, including The Complete Guide to the CQM and its accompanying CD-ROM. Comments can be e-mailed to Tom Pyzdek.
Every time there's a mild winter somewhere in the world, global warming talk speeds up.
And every time there's a mild winter one place (East, Great Lakes,) it's DAMN COLD somewhere else... (Colorado, etc...)
I can support that! In San Diego we're FREEZING!!!!
Thanks again--that makes a little more sense, though I'm still trying to understand the correlation between temperature and CO2.
No no no....the warmest December in recorded history.
Don't you go bringin' in January before the warmest December in history gets its mileage.
I live in NE TX. 'Global warming' is covering the trees and roads all over Texas. CA just lost most of its citrus crop with its 'global warming'.
I think that was someone else, but I agree.
Disclaimer: Opinions posted on Free Republic are those of the individual posters and do not necessarily represent the opinion of Free Republic or its management. All materials posted herein are protected by copyright law and the exemption for fair use of copyrighted works.