Mase's deceptive charts don't prove whether Americans are better off now than they were back in the 1970s. First of all, Mase's charts compare FAMILY income. The problem with his charts are manifold. The biggest of which is the growing number of American families that have been forced to become two income families just to make ends meet. For instance, there are 11 times as many working married women with children under 6 years of age. If the goal of Mase's chart is to determine if American's are better off today than in previous generations, then this renders Mase's deceptive stats meaningless: I agree that one must be very careful about reading too much into a small sampling of data. For example, Mase's charts in post #44 imply that wages have been going up. However, they look at just two real income levels, $50K and $75K, both of which are above the median wage. In addition, they are looking at family income, not individual income. On the other hand, the following graph contains U.S. Census data that shows that the real median income of full-time, year-round male workers has been stagnant since 1973:

The actual numbers and sources are at http://home.att.net/~rdavis2/ftyrinc.html. Then the following graph from the Bureau of Labor Statistics shows that the real average hourly wage of production workers is well below its 1973 high:

The actual numbers and sources are at http://home.att.net/~rdavis2//jobs.html.
U.S. Census data that shows that the real median income of full-time, year-round male workers has been stagnant since 1973: I saw an article recently where Paul Krugman came to the same conclusion. He didn't bother to explain how it is, 33 years later, that we're able to afford much larger homes with all sorts of upgrades our parents never dreamed of. He also didn't explain how it is that we have more cars, appliances, vacations, recreation vehicles, clothing, meals out, wealth etc. then we did in 1973. I guess all that wealth is just a figment of our imagination since the real median incomes of male workers hasn't increased since 1973.
Alan Reynolds took Krugman to task on this nonsense in an article called Unreal Wages.
The BLS has half a dozen superior measures of labor earnings -- the Census Bureau, Social Security Administration and Bureau of Economic Analysis have others. Real compensation per hour, for example, has risen 43.6 percent since 1973. So how could the real wages of 80 percent of the workforce have "fallen in most years" since then? They didn't. Wage stagnation is an old statistical hoax whose time is coming to an end.
Like me, Reynolds believes that real consumption per capita is a better measure of our increased living standards. Since 1973, he says our real consumption per capita has doubled. How can it double if our real per-capita wages aren't increasing?
Brian Westbury also addresses the doomers in his aptly titled article Pouting Pundits of Pessimism.
Moreover, for the past 30 years, real average hourly earnings have declined by an annual average of 0.1%. But this can't possibly reflect reality. In the past 30 years, cell phones and computers have become ubiquitous. Home and auto ownership have climbed. More people dine out; travel; attend sporting events, movies and rock concerts; and join health clubs. Over those same 30 years, real per capita consumption has increased at an average annual rate of 2.3%. Hourly earnings data do not include tips, bonuses, commissions or benefits, and therefore will always lag actual increases in living standards.
I've previoulsy linked you to Stephen Moore's article on income and wealth growth in this country since 1967. His findings should be repeated here:
The Census data from 1967 to 2004 provides the percentage of families that fall within various income ranges, starting at $0 to $5,000, $5,000 to $10,000, and so on, up to over $100,000 (all numbers here are adjusted for inflation). These data show, for example, that in 1967 only one in 25 families earned an income of $100,000 or more in real income, whereas now, one in six do. The percentage of families that have an income of more than $75,000 a year has tripled from 9% to 27%.
the Census data indicate that the income cutoff to be considered "middle class" has risen steadily. Back in 1967, the income range for the middle class (i.e., the middle-income quintile) was between $28,000 and $39,500 a year (in today's dollars). Now that income range is between $38,000 and $59,000 a year, which is to say that the middle class is now roughly $11,000 a year richer than 25 to 30 years ago.
The upper-middle class is also richer. Those falling within the 60th to 80th percentile in family income have an income range today of between $55,000 and $88,000 a year, which is about $24,000 a year higher than in 1967.
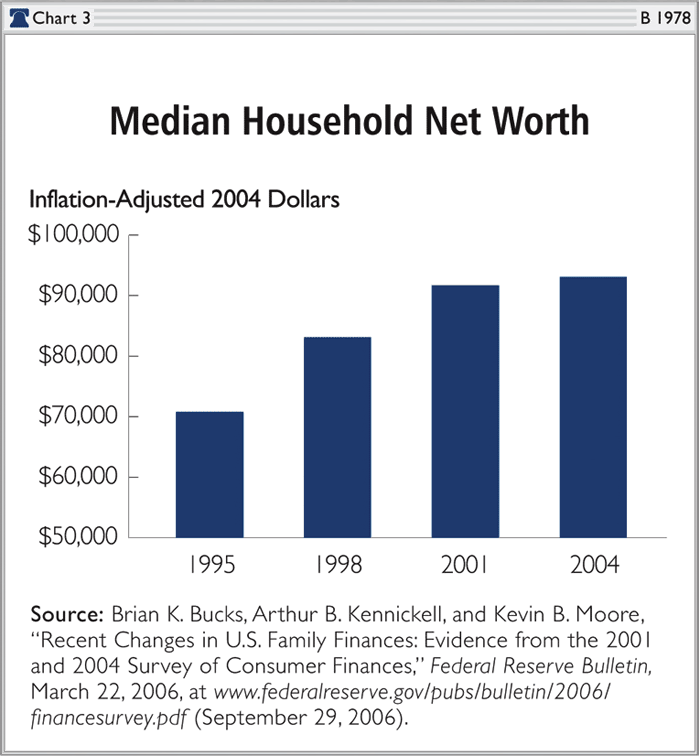
we estimated that number by taking the average ratio of mean wealth to median family wealth over the past 10 years. This yields an estimate of $105,000 in 2004. This is almost double the median family-wealth level of 1983 and nearly triple the level of 1962.
No way all this good news is possible if per-capita income for men, or any other demographic for that matter, has remained stagnant since 1973. For you to be right, all these guys have to be wrong, the household and median wealth numbers have to be fraudulent and all those cars, houses and toys we own today, along with the $4 trillion in capitals gains we've cashed in since 1997, have to be a cruel hoax being inflicted upon us by our overactive imaginations.