Posted on 09/06/2006 5:53:02 PM PDT by Coleus
The miocene era had CO2 levels that were 10 times what we have now and it was one of the coldest era's in earths history. The correlation of global warming and CO2 levels has not been proven.
That's one way to characterize it. Another way would be to negate any relevance to findings going back more than 400 years; to say that the findings between 150 years ago and 400 are shaky but not worthless; and that the claim that recent decades were the warmest in the last millenium is downgraded from "likely" to "plausible" - all while bending over backwards to be polite to Mann et al.
"We roughly agree with the substance of their findings," says Gerald North, the NAS committee's chair and a climate scientist at Texas A&M.
...This based upon support from other studies...which the committee didn't review.
North continued, emphasizing that the committee has "a high level of confidence" that the last few decades were substantially warmer than the previous four centuries.
Which is to be expected since four centures ago we were in the Little Ice Age.
Just to clear up this section.
Of course not. You have to understand that global warming doesn't necessarily mean that everything gets warmer. Some places get warmer, some places colder. Some places dry out, others are wetter. Or, returning to your question, if you believe global warming both more hurricanes and fewer hurricanes are proof of global warming. Don't you see? It's such a wonderful theory! It explains everything and everything is consistent with global warming.
Of course, since everything is consistent with global warming, it is completely useless as a theory since it can neither be proved right or wrong.
http://www.climateaudit.org/?p=810
"Many specific findings of the NAS panel show that they did not endorse the work behind the hockey stick. The NAS report stated that the Mann et al decentered principal components methodology should not be used; that temperature reconstructions should avoid the use of strip-bark bristlecones and foxtail proxies; that the Mann et al reconstruction was strongly dependent on these problematic proxies; that their reconstruction failed important verification tests; and that they had incorrectly estimated uncertainties in their reconstruction.
"At the press conference, panel chairman North said that he agreed with the “substance” of the Mann et al reconstruction. However, this language is nowhere used in the report itself, where the panel expressly referred to the reconstruction merely as “plausible” and specifically withheld any attribution of confidence intervals for the period before 1600. "
The above site, is run for Stephen McIntyre of the abovementioned Ross McKitrick and Stephen McIntyre.
If you are against CO2 in the atmosphere you are against the planet being green.
If...if correlation were cause. Life's a journey, enjoy the ride.
In the late60s to early 70swe were being warned of the coming ice age, now we're worried about global warming!!!!!
I wish the chicken littles would make up thier minds!!
I've noticed much more frequent, intensely good weather this Spring and Summer. More proof of global warming!
I've known quite a few scientists who debate different theories in a variety of fields, and respect the people who hold opposite viewpoints. When it comes to the climate sciences however, these same scientists will dismiss those in the 'human impact is non existent or trival' camp as lone nuts or zealots. This is what makes me think that, for them, global warming is much more a 'faith based' issue rather than a scientific one.
That's one of the reasons that the bristlecone pine proxies that Mann used are considered "divergent"...modern levels of CO2 obviously greatly increase ring size. The thing going back in time is that they can't readily distinguish between wet and cool, nor do they collect environmental data year-round. The study Mann used for data to do his 98 and 99 studies even points out the trees are unreliable proxies for these reasons.
Read a paper that corrects a previous study: Included in it will almost invariably be a statement of faith on how despite this, clearly there is anthropogenic global warming and it is predominent - even though the paper itself doesn't address such a thing.
She earth plenty angry.
No like iron horse SUV. Puffing wheel machine heat earth.
Penguin gods, him heap upset that polar bears melt maybe and big wind god eat many house in big shrimp water where buses float. Must sacrifice virgin or ice spirit tell Nannaboojoo eat white man. Bad, bad white man.
Corn god, him like ethanol. Him need government subsidy. Him go to bad moon god and make heap big war. Corn god, him eat moon maiden, stop heat earth with government subsidy.
Big wind god, him go Hyannis stop hot earth. Kennedy god, him no like wind god. We ride with Kennedy god on short pier and pow-wow...
There's a reason for that. Solar insolation decreased over Antarctica at approximately the same time that atmospheric CO2 concentrations were decreasing. Changes in ocean circulation led to the climatic isolation of the Antarctic continent, and this set up essentially a new climate system. The change was most notably a shift in the Milankovitch forcing. Formerly the obliquity variable was the most important; during the Miocene the eccentricity variable became more dominant than the obliquity variable.
And actually your statement isn't entirely accurate. The Miocene marks a period of major ice sheet expansion on Antarctica, but the Plicene and the Pleistocene were colder.
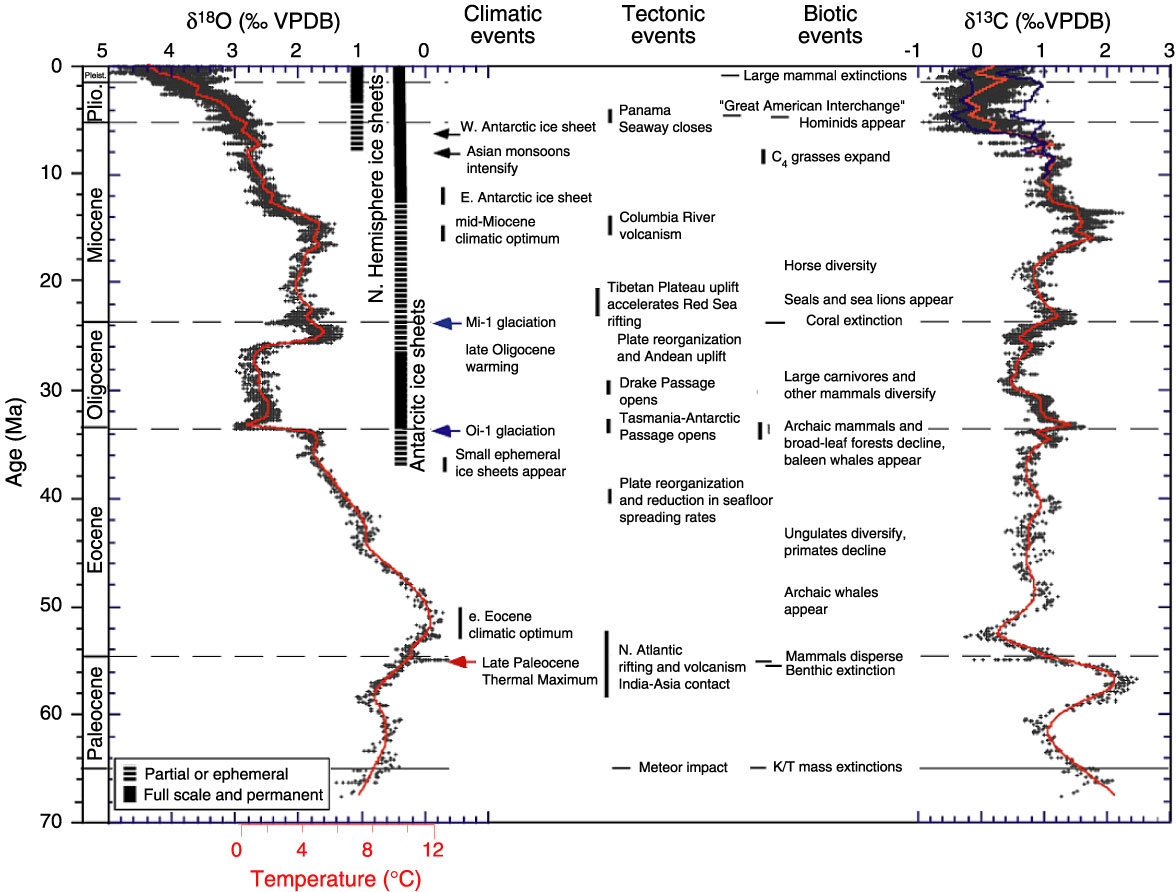
IN the chart below (reduced in size; click on it for the big full-resolution chart), the oxygen-18 isotopes are a proxy for temperature. Essentially the Miocene was the beginning of a colder era in Earth's climate history, "setting the stage" for the continental glaciations in the Pleistocene.
(This is a nice chart, as it shows major tectonic shifts in paleoclimate history, a factor that is often overlooked. Until the closing the Central American isthmus, ocean circulation was much different than present, so direct comparisons to past climate states prior to the Pliocene are problematic.)
Also note in this chart the relatively brief Paleocene-Eocene Thermal Maximum, caused by a major release of methane which was oxidized to CO2 in the atmosphere, causing a short, radiatively-forced global warming episode.)
See post 18 for a more detailed view of the Cenozoic.
Nice chart.
Disclaimer: Opinions posted on Free Republic are those of the individual posters and do not necessarily represent the opinion of Free Republic or its management. All materials posted herein are protected by copyright law and the exemption for fair use of copyrighted works.