Section 2. Analysis of the 17th Street and London Canal Breaches and Post Katrina Flood Sequence in Downtown New Orleans
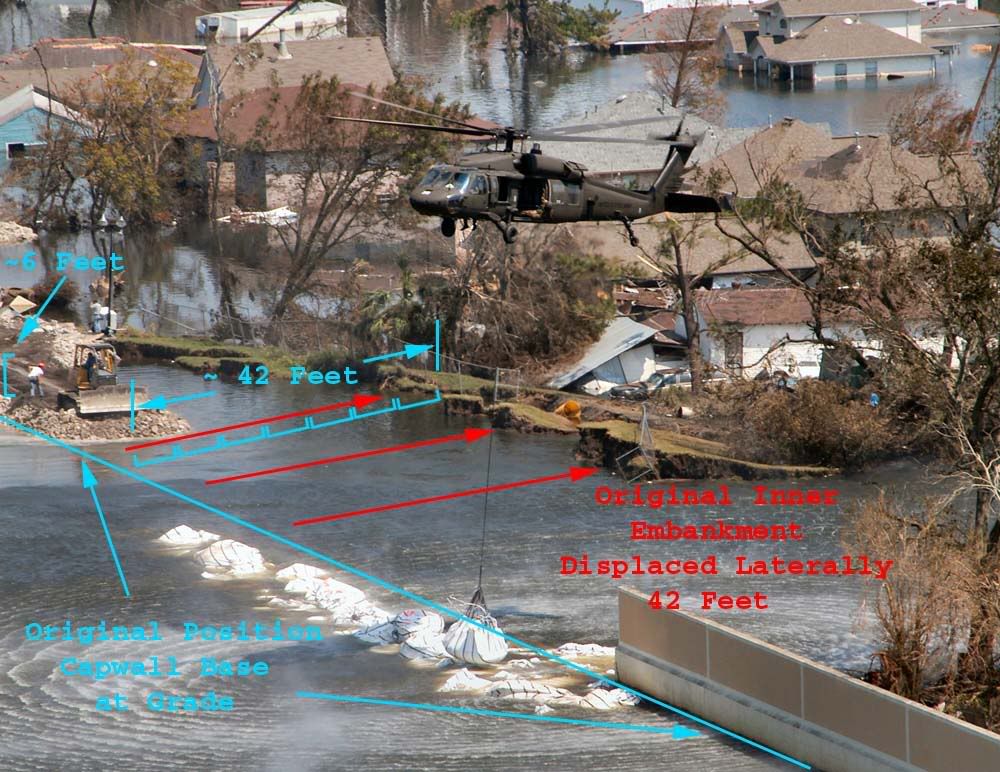
The images below clearly indicate the failure mechanism in the 17th Street Canal and London Canal I-Wall breaches. In the first image, from the 17th Street Canal breach, a layer of weak or weakened subsoil succumbed to lateral loads imposed by elevated water levels fed into the canal by storm surge on Lake Pontchartrain's southern shore, allowing the entire cross section of the embankment and capwall to be displaced an estimated 42 feet from their pre-storm position.
Similar evidence is shown in the image below from the southern London Canal breach.
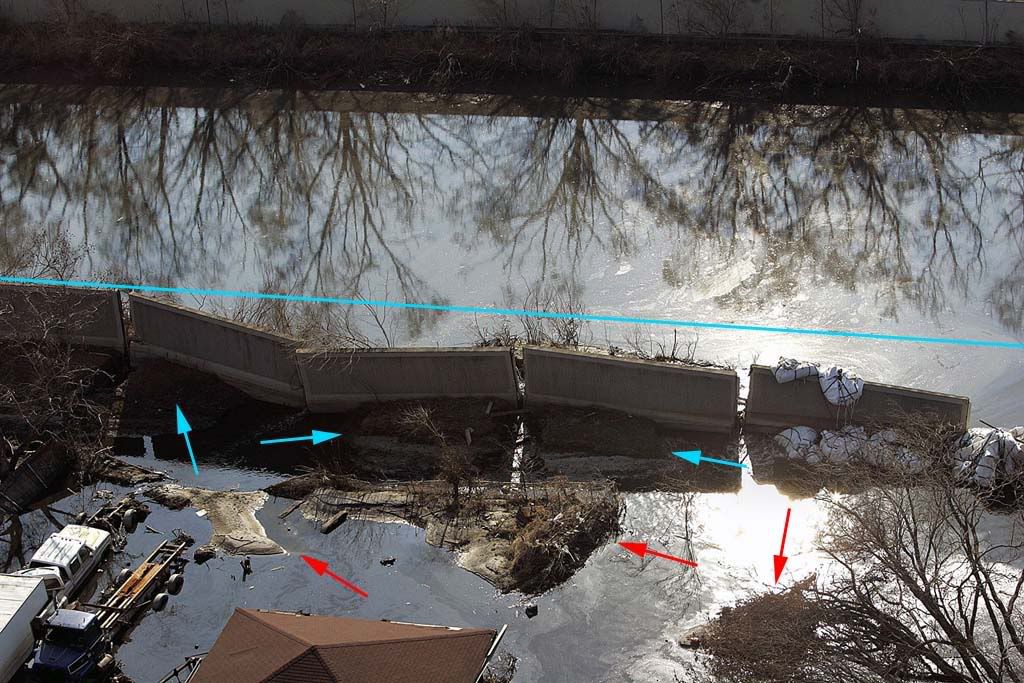
In addition, the image above gives some indication of the depth of the weak or weakened layer at this location. The cross-image blue line represents the approximate original position of the capwall's crown prior to the storm. Sections of the inner embankment were displaced as outlined above by the pressure of the high water on the canal side of the capwall, noted in the image at the blue arrows.
The red arrows, however, denote area of soil displacement which originated well behind the embankment and above the weak or weakened layer, and which were displaced and folded upwards when the embankment and capwall pushed them back in the course of its own displacement. These are secondary effects and almost certainly due to the same weak layer at some depth below original grade.
Because the post storm imagery indicates similar failure mechanisms between the 17th Street and London Canal breaches, the following discussion will not discriminate between the two locations.
At some point prior to failure, the resistence to lateral displacement of certain sections of the embankment, resistance owed primarily to the embankment and capwall's weight, footprint area, and the weak layer's "coefficient of friction", was approached by the potential energy of the weight of the surge water pushing in against the levee. When the two opposing forces reached equal magnitude, that section of the levee was essentially "floating" on top of the weak or weakened subsurface soil layer. This condition probably extended over a wide area, as original soil tests indicate that the weak soil layer was not an isolated occurrence. The variables which ordained certain sections to failure, while allowing other sections to survive, may never be fully known, but analysis of these must include the following possibilities:
1. Weak layer depth. A shallow weak area would necessarily support a lesser weight of soil above it, decreasing the resistance of all supported layers to lateral displacement, by reducing the force normal to the weak layer.
2. Embankment variations in cross section. Again, lower volumetric cross sections would exert less normal force (weight) on the standard layer/weak layer interface, and therefore allow less resistance to lateral displacement.
3. Percolation, seepage, and liquid entrainment in the weak layer and surrounding layers. As the water levels in the canal increased, pore pressure in the surrounding soils increased, almost certainly increasing percolation and entrainment. A saturated soil layer would have a net bouyant effect on anything immersed or supported by that layer. Percoaltion could also displace soil at critical locations, resulting in subsidence and loss of coherent structure in both supporting and supported layers. Transport of clay or slurry into or along the slipping interface between the weak layer and the displaced layers would further reduce resistence to lateral displacement.
4. Static and dynamic hydraulic forces. All three I-Wall failures occurred in close proximity to roadway bridges over the canals. Of these, the 17th Canal breach and the northern London Canal breach occurred just south of the roadway bridges, "downstream" to the flow of surge south from Lake Pontchartrain. The southern London Canal breach occurred just upstream from the bridge. Turbulence, standing waves, increasing or decreasing flow rates, helical flow regimes or standing vortices, all a potential result of bridge abutments, abutment foundations, piers, or pier foundations could contribute to localized variations, both static and dynamic with respect to time, in the hydraulic pressure exerted on certain sections of the I-wall system.
Regardless of what contributory factors led to the localized breaches, the breaches did in fact occur, setting in motion a precise chain of events culminating in the situational evidence available today. As the hydraulic pressure approached and then exceeded the levee section's ability to resist lateral displacement, the I-wall and embankment began to slide backwards, at first as a complete unit. Very soon there-after, however, the joints between the capwall's monolithic concrete sections came into tension as the no longer straight capwall attempted to lengthen to accomodate the new non-linear path. While these joints in many cases did not immediately fail, they also did not retain their watertight integrity, as evidenced in the post storm images above, allowing surge to flow in between capwall monoliths, eroding and scouring localized segments of the levee embankment.
With the full depth of the water's force applied to the capwall and sheet-piling, and only a partial depth of the force applied to the unprotected side of the levee embankment, in many instances the sheet-piling, capwall monoliths, and protected side of the embankment continued to be displaced, further and further from their original positions, leaving the outer embankment behind, in some cases all the way back in its pre-storm original position.
As the canal side of the embankment separated from the sheetpilings, the sheet pilings lost a great deal of support, allowing them greater latitude to deform and/or to lean backwards. Whether the sheet-pilings and capwall monoliths parted company at this point is immaterial, once freed of the embankment they rotated flat so as to offer the least resistence to the now flowing surge water, much as the links of a chain will orient themselves in accordance with a similar viscuous flow, stretching and in some cases rupturing the link mechanisms between capwall monoliths (sections). In many respects, the capwalls offered us valuable assistence. Although the breaching was now structurally complete, the flattened capwall monoliths offered some protection to the rear embankment, preserving the evidence for us to analyse after the floodwaters receeded, much as a rip-rap facing protects a surviving levee embankment from flow, scouring, and direct immersion.
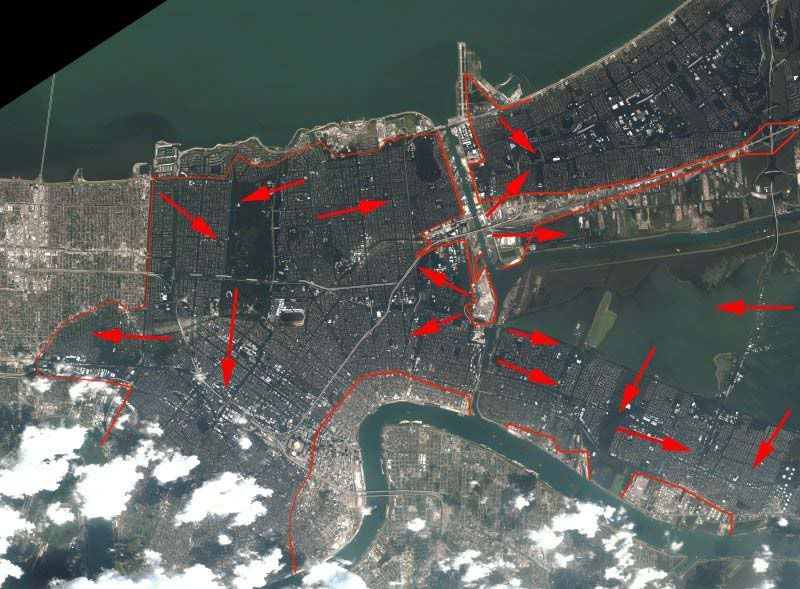
The flooding of the New Orleans downtown area originated from five major breaches, two in the Industrial Canal area, two along the London Canal, and one along the 17th Street Canal. The low lying sections of the urban area filled first, then became conduits for floodwaters to reach areas of higher elevation. The flooding seems to have stopped at the 3.0 to 3.5 foot ASL mark. Shortly after Katrina's passage, water levels in Lake Pontchartrain were measured at 5.5 feet ASL and dropping. Due to the relatively small area of the breaches and the large area of the city below sea level, the levels did not equalize until the Lake levels had dropped to between 3 and 3.5 feet ASL. The image below indicates the sources and directions of the major flooding sequences. Note that the ridge from Metairie extending west and south prevented floodwaters from levee breaches from reaching the Kenner and surrounding areas. The flooding in those areas was entirely due to failed, deliberately shut down, or overloaded pump stations in Jefferson Parish.
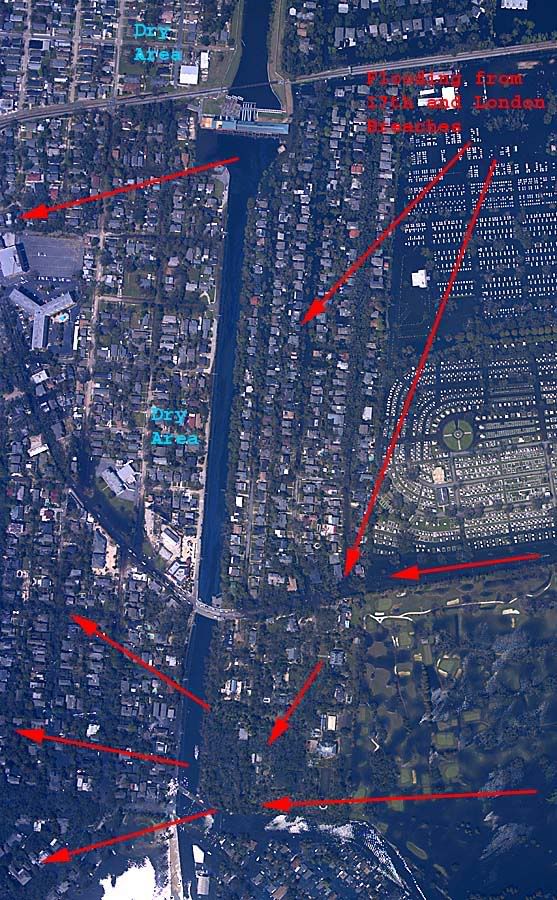
There were many media and anecdotal reports of a second breach along the 17th Street Canal, which led to the Metairie flooding south of Airline Drive. The best data available does not support these claims. Instead, as the flood levels from the previously discussed breaches deepened, eventually the water level topped the lower, inland canal walls south of the 17th Street Canal pumping station, on both sides of the canal, and flowed west from there, as evidenced in the image below.
Prior to Katrina's arrival, counter-clockwise winds along the northern and western reaches of the storm caused a surge along Lake Pontchartrain's southern shore. While some have debated the maximum depth of this surge, which was equaled in the connected 17th Street and London canals, the available evidence clearly shows that the Lake Pontchartrain levees were topped by storm surge or prolonged wave action.
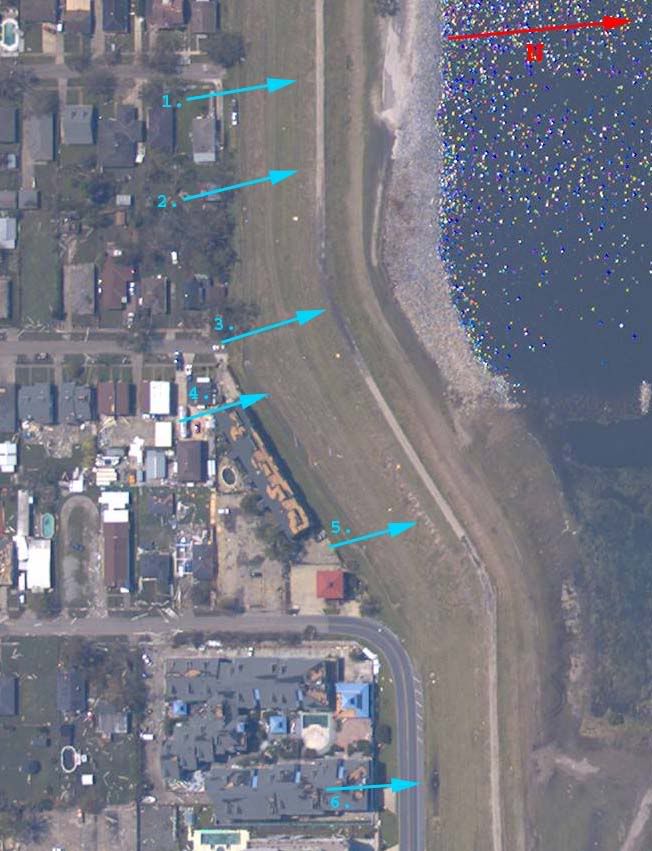
The above image clearly indicates topping of the Lake Pontchartrain levee immediately west of the 17th Street Canal outlet. Arrows at 1, 2, 4, and 5, point out evidence of fill transport, scouring, and topping at all elevations of the protected inner face of the embankment, base to crown. The dark area indicated by arrow 3 shows ponding still evident along the bike path atop the levee, and arrow 6 denotes ponding still evident along the inner base of the levee embankment. Per CoE documents, this section of the Lake Pontchartrain levee stands 14.5 feet ASL.
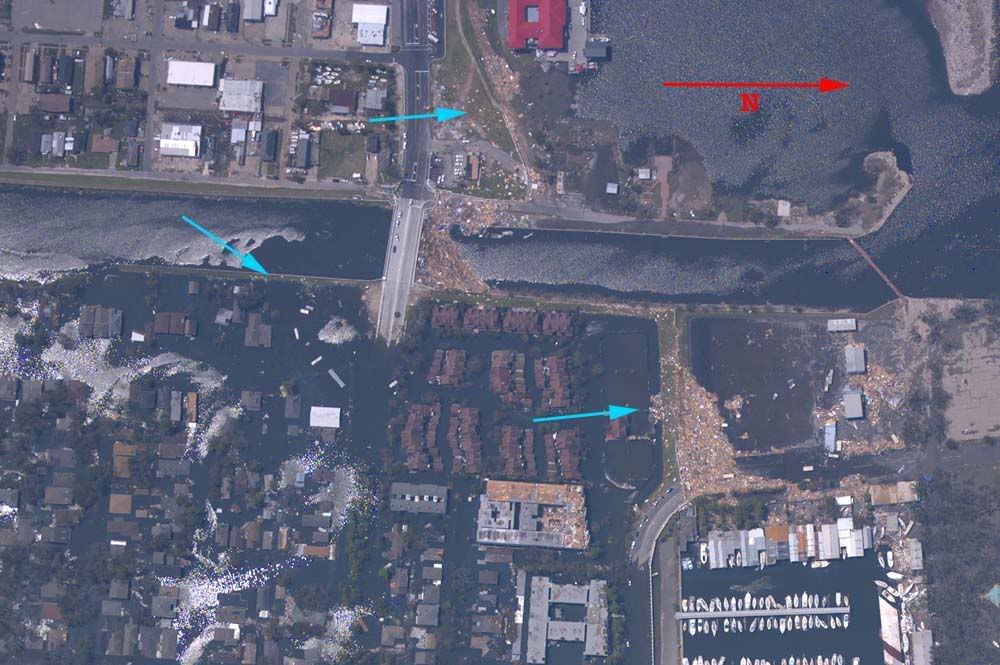
The above image clearly indicates topping of the Lake Pontchartrain levee immediately east of the 17th Street Canal outlet. The 17th Street Canal breach is shown at left center of the image. The blue arrows indicate locations where surge transported significant quantities of storm debris over the Lake levee's crown to deposit it on and below the levee's inner face. Per CoE documents, this section of the Lake Pontchartrain levee stands 13.5 feet ASL.
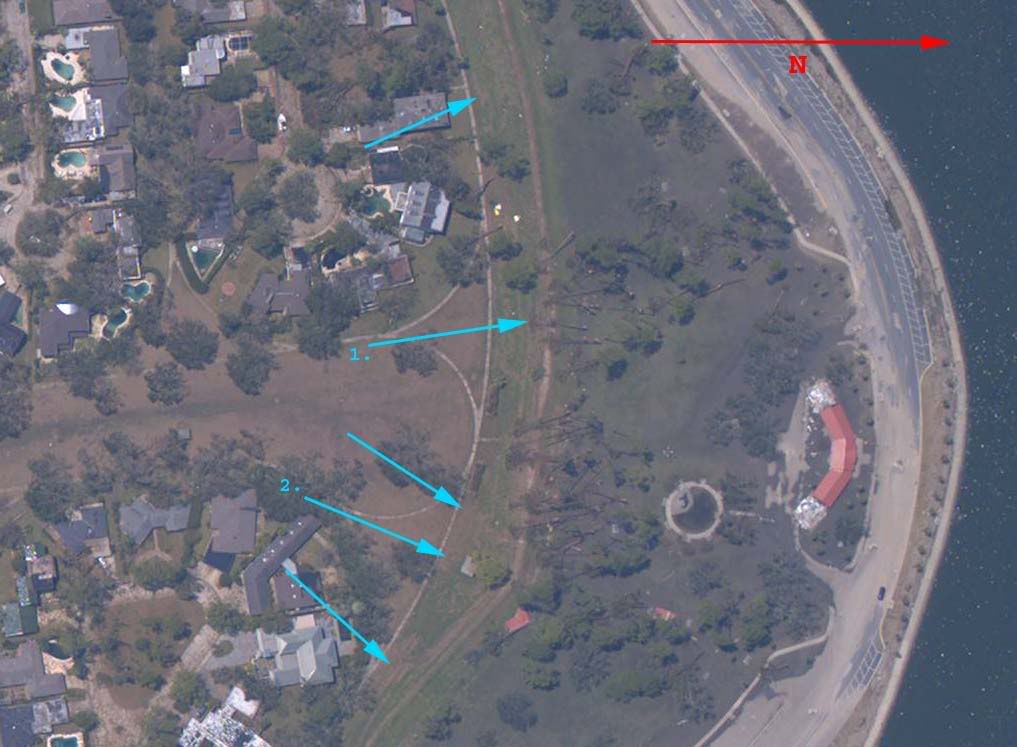
The above image clearly indicates topping of the Lake Pontchartrain levee immediately west of the London Canal outlet. The arrow at 1 indicates large trees transported by the surge over the crown of the levee embankment. The arrow at 2 indicates surge transported debris from the structure at right center to its present location, inside the protective embankment. The other arrows indicate fill transport and scouring along the inner face of the levee embankment. Per CoE documents, this section of the Lake Pontchartrain levee stands 17.5 feet ASL.
With both the London and 17th Street Canal outlets fully open to Lake Pontchartrain, demonstrated surge levels ranging from 13.5 to 17.5 feet above sea level would also have topped the 13.5 foot ASL Canal I-Walls. The city of New Orleans and the State of Louisiana, along with considerable federal funding, paid for storm surge protection to 11.5 feet ASL.
"The New Orleans area's last line of defense against hurricane flooding is a 475-mile-long system of levees, locks, sea walls and floodgates averaging about 16 feet high. The Army Corps of Engineers says the system will protect the city and suburbs from a Category 3 hurricane that pushes in enough seawater to raise Lake Pontchartrain 11.5 feet above sea level -- high over the head of anyone standing on the other side of a levee."
Source
The city received protection to levels of 13.5 to 17.5 feet ASL in the vast majority of locations, two to six feet above what was paid for, yet three locations unfortunately did fail under the impact of surge well in excess of the pre-approved design specifications, and allowed the city to flood. Although additional design considerations might have protected the entire I-wall system to Katrina's fury, and allowed the downtown area to escape the resulting devastating post storm flood damage, this must be attributed to an act of nature rather than a design or construction failure. New Orleans got all it paid for in I-walls, and then some.
Section 4. Lower Ninth Ward and St. Bernard Parish Flood Sequence
Reference Map
Subsection A. Selected Anecdotal Reports
Subsection B. Indications of Scouring and Material Transport Direction
Subsection C. Flood Sequence in St. Bernards Parish
Subsection D. Causal Failure Analysis for the MRGO Primary Protection Reach
Reference Map
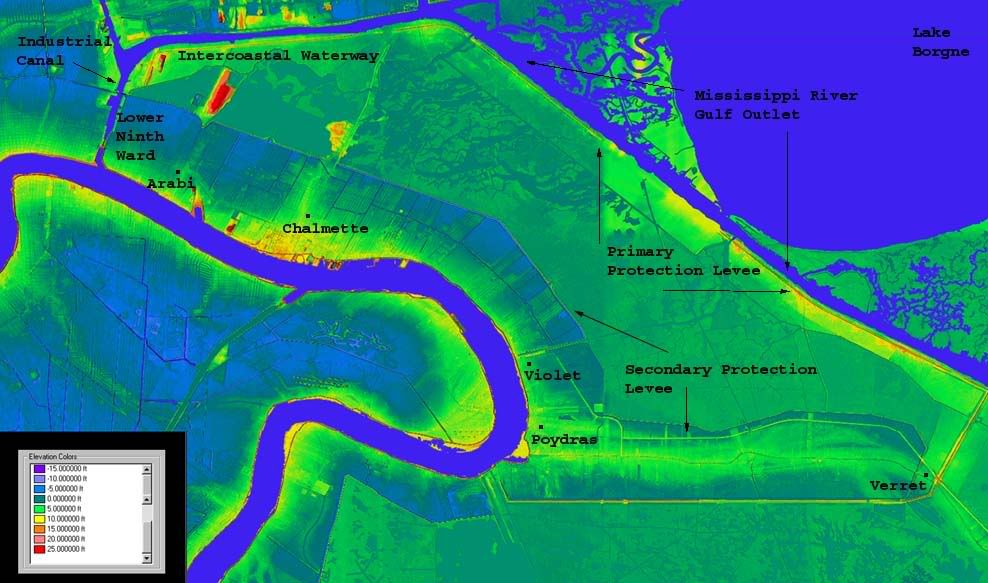
The above image is rendered from a 3 meter per pixel DEM, showing the St. Bernards (and Lower Ninth Ward) Hurricane Protection Levee system, with sea level artificially lowered to negative 15 feet in order to display the protected areas in their normally dry state.
This image is to serve as both a geographical reference point for the following discussion, and also as an elevation reference for future images used for correlation purposes.
Subsection A - Anecdotal Reports
St. Bernards Parish suffered not one flood but two.
Clearly, the first reports indicate that the Lower 9th Ward flooded first, with Arabi close behind. The National Weather Service Flood Warning resulting from the Industrial Canal breach at 0814, together with the following account, demonstrate this:
"Arabi resident Donald Bordelon told a Times-Picayune reporter via cell phone that at 8:30 a.m. there was just wind damage the homes on his block of Schnell Drive. But 40 minutes later, floodwaters had risen over the stove in his kitchen, as he scrambled to ready his boat for an evacuation."
http://www.nola.com/newslogs/breakingtp/index.ssf?/mtlogs/nola_Times-Picayune/archives/2005_08.html#074977
Given the time proximity of the NWS and Bordelon reports, along with the absence of early flooding reports from points east of Arabi, it is likely that floodwaters from the westernmost St Bernards breaches on the Industrial Canal reached Arabi much earlier than floodwaters from the eastern breaches along the MRGO.
From further south, and later, in Poydras, south of Violet, we get this report:
It was 11 a.m. on Monday Aug. 29, and the Campo men were in a celebratory mood. Katrina's eye and its vicious 145-mph winds had passed close to the area but they had come through unscathed in the house just 200 yards from the river levee. They really weren't surprised.
When I built my house, I chose that land in Poydras because everyone said it had never flooded there, ever; Kenny said. That's why we evacuated there. We had locked down grandpa's house, the hoist and the business on Sunday, our families had gone to Baton Rouge, and we'd come to my house because – like grandpa said – it never floods in Poydras.
And after the first part of Katrina passed, it still hadn't flooded.
With a new generator purring, the men watched the storm's progress on TV and were preparing to have some lunch. Kenny went outside bare-chested and bare-footed to pick up the few shingles blown off his roof. That's when he heard a peculiar hissing sound, and looked up the street.
Water was coming down the street, then from the other yards, then up the street, it was just pouring in from everywhere, he said. By the time I got back to the house, it was up to my knees.
His alarms dumbfounded his father and grandfather.
"Kenny comes in yelling, "We got to get out of here! We got to go!" and I didn't know what he was talking about," Ken Sr. said. "Then, the water started coming in the house.
The men ran to their two pickup trucks, Blackie joining Kenny in one, Ken Sr., in the other, and with the water rising fast made a hurried, fateful decision.
"As we're getting in the pickups, I'm thinking about where we should go",Ken recalled. At first I thought we should try to get to St. Bernard High School, then maybe the courthouse. But the levee was right there, so we just took off and drove up to the top of the levee.
Let me tell you, maybe 15 minutes had passed since Kenny saw that water until the time we got to the top of the levee, but by then there was seven feet of water in his house, and it was still rising. We were on the only high ground left. If we'd tried to go anywhere else, we would have all drowned.
They were safe, but only for the moment. Katrina's winds returned, blowing from the northwest with a vengeance."
http://www.macchuck.com/Katrina/stories/Campo.html
It's difficult to place much credibility in the time of day given with this report. For the southwest quadrant of Katrina's inner eyewall to have passed over Poydras at some time after 11 AM CDT, the inner eye would have had to have a diameter of 95 miles, since the reported location of the eye center at that time was slightly south of Picayune, Mississippi.
Katrina Track Timeline
It is possible that this is a time zone discrepancy, and that the time reference actually refers to 10 AM CDT. This would give an eyewall radius of 28 miles, and given the 1000 CDT position, much more in line with the estimated eyewall radius at landfall of 20 to 24 miles.
However, what is clear is that the flooding in Poydras occurred much later than that in Arabi, giving us a general direction and sequence of the flow pattern. These anecdotal reports, coupled with analysis from aerial imagery, allow a fairly detailed picture of the flood sequencing to emerge.
Subsection B. Indications of Scouring and Material Transport Direction
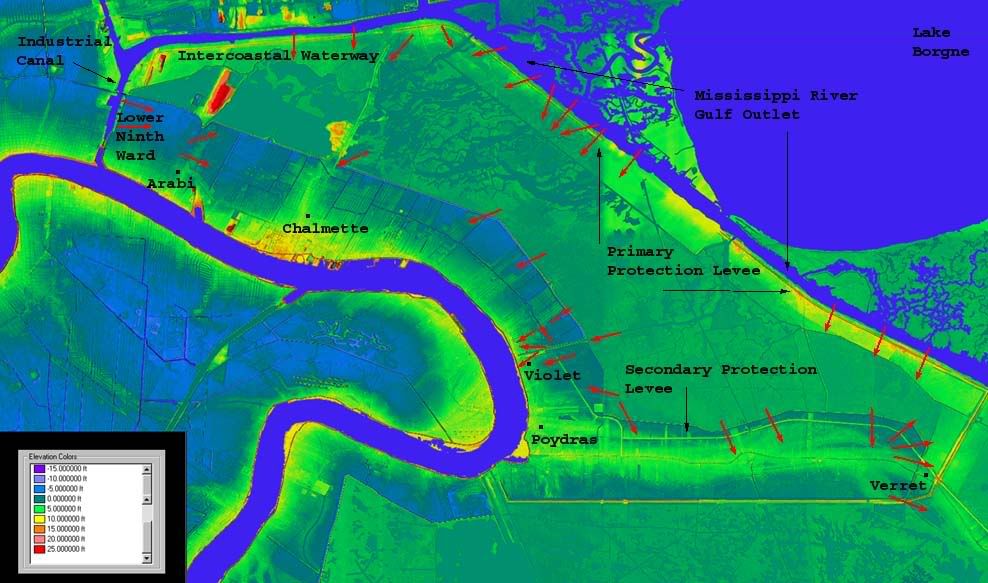
In the above image, each red arrow represents soil, vehicle, or structure displaced by moving water, visible from aerial photographs. This data leads to the following probable sequence of the St. Bernard Parish flooding.
Subsection C. Flood Sequence in St. Bernards Parish
1. 0730 - 0800 CDT: Levee sections all along the MRGO are topped, at first by localized waves, later perhaps more extensively, especially along sections subject to subsidence.
2. 0745 - 0830 CDT: A storm surge of approximately 15 to 18 feet is funnelled west along the Intercoastal Waterway, then north and south into the Industrial Canal. As it enters the Industrial Canal, the surge is probably not more than 14 feet, the excess having been bled off along the 14 foot levee south of the Intercoastal Waterway during transit.
3. 0800 - 1000 CDT: Storm surge begins breaching low sections along the MRGO, gradually filling the basin between the Primary and Secondary Protection levees. Paris Road, visible on the above image extending northeast of Chalmette to the Intercoastal Waterway forms a temporary protective barrier until the basin fills to a depth of about 5 feet ASL, at which point surge begins spilling over (initially at the northern end of the Paris road) into the basin north of Chalmette and south of the Intercoastal Waterway. This is augmented by minor topping of the Intercoastal Waterway's southern levee.
4. 0805 - 0810 CDT: Surge driven flow and possibly a loose barge breach two sections of the east levee of the Industrial Canal, spilling into the Lower Ninth Ward from the west. This flood fills the Ninth Ward, northern Arabi, and western Chalmette to depths of between 5 to 8 feet. The Paris Road ridge running north north east from Chalmette prevent most of this water from flooding areas further east.
5. 0930 - 1000 CDT: As the basin between the Primary and Secondary Protection levees fill to depths of between 6 and 8 feet ASL, large sections of the Secondary Protection levee are topped, and surge begins spilling into eastern Chalmette, Violet, Poydras, and northern Verret. At this time or slightly earlier, surge flowing west down the Violet Canal towards the Mississippi River tops and then breaches levees on both sides of the canal, spilling into areas north, east and south of Violet.
6. 0945 - 1030 CDT: As the basin from Chalmette south to the north bank of the Violet Canal fills to approximately 6 feet ASL, the Paris Road embankment is topped, and water begins flowing back into west Chalmette, Arabi, and the Lower Ninth Ward, slower this time because of the gradual addition of deeper flooding. There is variability in the exact timing and depths that the reversal in flow took place. Floodwaters from the Industrial Canal breaches probably reached heigths of 5 to 8 feet, and some flow over the Paris Road west to east occurred before the deepening water east of Chalmette outpaced this flow and reversed it. The relative absence of structures displaced by moving water around Chalmette indicate that the transition from eastward to westward flow was accomplished non-violently. During this same approximate period, water from the basins due north of Chalmette and Arabi began topping the Secondary Portection levee and into those towns respectively. Again, little structural damage from this flow is visible on the overhead images, except for those residences and buildings directly adjacent to the Secondary levee.
7. 1000 - 1100 CDT: As Katrina moved north, winds on the southwest quadrant gradually changed from southward, to southeast, eventually blowing directly towards the east as Katrina's now disintegrating center moved further and further away. At the point where the primary winds turned parallel to the Primary Protection levee along the MRGO, wind driven surge stopped entering the breaches there, and at the point when the surge levels in MRGO dropped below levels inside the protected (no longer) areas, water began flowing out of the breaches into the MRGO. Somewhere in this general time period, west moving floodwaters from Chalmette and Arabi reached the Industrial Canal breaches and water began flowing from the protected areas out into the Industrial Canal. At this point photographs show flood levels in the Ninth Ward at or very close to the tops of the levee, or 13 feet ASL. Because the Secondary Protection levee is only ten feet ASL near Arabi, dropping to 7.5 feet near Verret, as the water between the Primary and Secondary Protection levees flowed out the MRGO breaches, floodwaters in eastern Chalmette, Violet, Poydras and Verret reversed direction and began flowing over the Secondary Protection levee, causing significant scouring to the outside (unprotected) face, and possibly additional breaches, notably northwest of Verret and immediately south of the Violet Canal. Even several days later when the aerial photographs were taken, floodwaters inside the Secondary levee from Chalmette to Verret were still deeper than those outside, between the Primary and Secondary levees.
Subsection D. Causal Failure Analysis for the MRGO Primary Protection Levee
Of the easternmost sections or reaches of the St. Bernards Parish primary protection levee, 87.9 percent are within the aerial photography grid covered by the National Oceanographic and Atmospheric Administration shortly after the storm. Of the portion visible, 60.5 percent of the eastern reach is partially or totally destroyed.
Post storm analysis strongly suggests the causal factors behind these breaches, and further refines the failure mechanism. Portions of the levee embankment which underwent higher pre-storm subsidence rates than adjacent sections, failed, and portions of the levee embankment which sank more slowly than the surrounding areas survived the storm. This claim is not made lightly. Correspondence between the two factors averages 87.5% for the entire length of the levee embankment visible on the aerial photographs, with minimum correspondence of 70% and multiple areas with 100% correspondence between subsidence and failure, and further, also exhibiting 100% correspondence between low subsidence rates and levee survival.
In the images below, the following conventions are used. The upper pane is an extract from the relevent aerial photograph depicting that section of the levee, and the lower pane is rendered from 3 meter per pixel Digital Elevation Models with sea level artificially raised or lowered to approximate surge effects and to demonstrate the localized height differentials in the levee crown.
Black arrows indicate terrain feature location commonality between the two different types of imagery. Light blue arrows indicate areas which exhibited low rates of subsidence and survived the storm with minimal fill transport, cratering, or breaching. Red arrows indicate areas with high subsidence rates which significantly or completely failed during the storm. Green arrows, where they appear, indicate areas where the presence or absence of subsidence in the elevation models does not correspond to levee survival or failure visible in the aerial imagery.
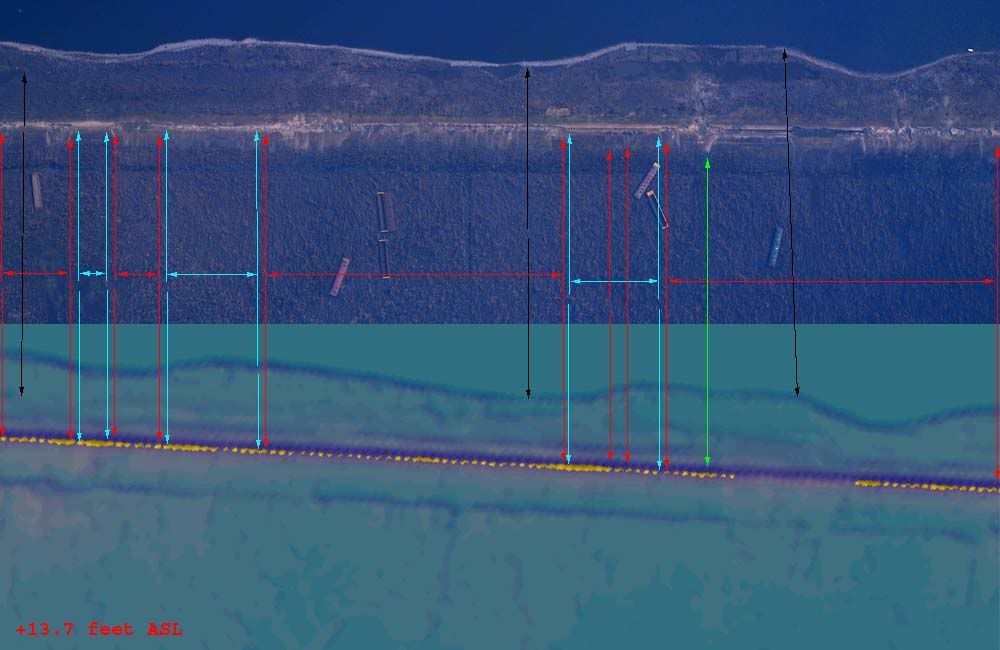
In the above image, sea level was artificially raised to 13.7 feet ASL before segments of the levee crown began disappearing below the water's "surface". Correspondence between subsidence and survival or failure is judged to exceed 90 percent. The green arrow indicates a full breach visible in the aerial photograph which corresponds with an area of low subsidence relative to the adjacent segments, but which also resides within a larger levee segment almost totally destroyed during the storm. While technically refuting the proposed subsidence/survival correlation, this is probably a case where subsidence related failure on either side of the breach led to localized isolation of that segment, with surge flowing into protected areas on both sides of it, inducing failure at a later point in time. Correspondence between pre-storm subsidence and levee survival or failure elsewhere within the image is judged at 100 percent.
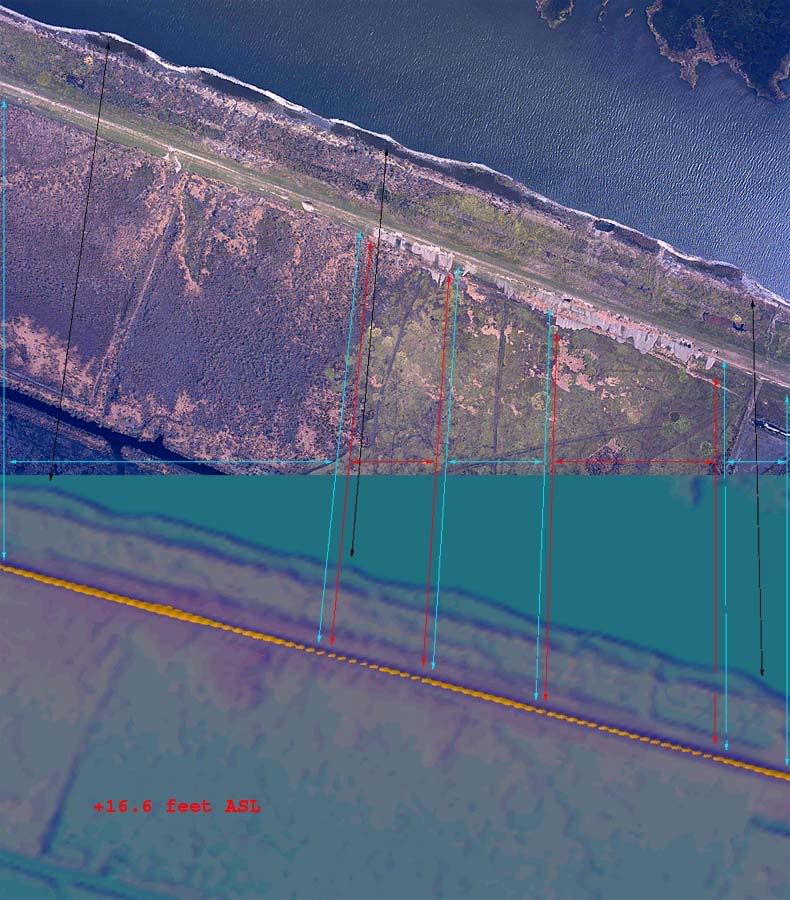
In this image, sea level has been artificially raised to 16.6 feet ASL, and correspondence between pre-storm subsidence and levee survival or failure is judged at 100 percent.
The following images are arranged in order of descending correspondence between pre-storm subsidence and levee survival or failure, and are made available as links instead of being displayed here in order to reduce bandwidth requirements and page load times. Image 6 never existed, image 7 is physically adjacent to image 5 within constraints imposed by data availability, a previous numbering scheme was maintained to preserve file system cross references, and therefore, no link to Image 6 is presented.
Correlation 8
Artificial surge level at 16.3 feet ASL, correspondence between pre-storm subsidence and levee survival or failure judged to be at 100 percent.
Correlation 7
Artificial surge level at 16.1 feet ASL, correspondence between pre-storm subsidence and levee survival or failure judged to be at 95+ percent.
Correlation 5
Artificial surge level at 14.5 feet ASL, correspondence between pre-storm subsidence and levee survival or failure judged to be at 90+ percent.
Correlation 3
Artificial surge level at 14.9 feet ASL, correspondence between pre-storm subsidence and levee survival or failure judged to be at 80 percent.
Correlation 2
Artificial surge level at 15.3 feet ASL, correspondence between pre-storm subsidence and levee survival or failure judged to be at 70 percent.
Correlation 1
Artificial surge level at 12.0 feet ASL, correspondence between pre-storm subsidence and levee survival or failure judged to be at 75 percent. The flowing breach immediately to the right (southeast) of the Bienvenue Bayou flood control gate structure was a deliberate breach per CoE sources.
With the correspondence between pre-storm subsidence and levee survival or failure firmly established, it becomes possible to investigate deeper into the precise failure mechanisms that led to the open breaching and cratering of the Primary Protection System.
It would be simple to conclude that the segments of the levee subject to the highest subsidence rates were topped by Katrina's storm surge, and that the topping scoured the embankments down to their post Katrina levels of survival. This conclusion, however, is not in accordance with the data available. Had Katrina's surge reached a maximum of only 12 feet ASL, then all sections of the levee other than those depicted in image 1 would not have been topped, would not have been scoured, would not have been breached, and the correspondence we see between pre-storm subsidence and levee survival and failure would not exist.
Had Katrina's surge reached 16.6 feet ASL, the level necessary to produce the 100 percent correspondence we see in many areas, between pre-storm subsidence and levee survival and failure, the entire eastern reach of the Primary Protection System would have been topped, all then subject to the same scouring, and the entire reach exhibiting total or near total breaching. Again, the correspondence we see between pre-storm subsidence and levee survival and failure would not exist.
Instead, we must reach for another failure mechanism, one which explains why segments of the levee which were subject to the highest rates of pre-Katrina subsidence were also most subject to full or partial breaching and cratering, independent of being topped. Two such mechanisms immediately come to mind.
One such mechanism deals with the quality of the soil upon which the levee rests. If the foundational soil layers beneath the Primary Protection System were not homogenous throughout the entire eastern reach, then some areas of these foundational layers would display differing qualities of soil cohesion, compressability, percolation and seepage, and shear strength. The levee segments resting on these weak areas of foundation soils would show a tendency to sink faster than areas resting on better foundation layers, and the weak foundation would allow percolation and seepage to undermine the structure above it, possibly leading to early failure.
The other failure mechanism deals with the stability and integrity of the levee embankment itself. During construction, design specifications clearly indicate the soils to be used in any levee layer, the thickness of each layer, and the methods necessary to compact each layer before adding additional material on top of that which has already been laid. Differential settlement rates along adjoining levee segments could impose significant stress to compacted fill layers, including shear, bending moment, and tension. This stress could disrupt each layer's cohesiveness and ability to resist lateral loads. In extreme cases, cracks could develop which could in turn allow percolation through the embankment, carrying away fill as surge flow through the cracks continued and increased.
The two most obvious failure mechanisms that correlate pre-storm subsidence and levee failure than, are foundational issues, and issues within the embankment itself. If foundation issues turn out to best represent the post storm data available, then both the subsidence and failures result from the same root cause. If, however, embankment cohesivness issues turns out to be the primary failure mechanism, then the subsidence created secondary effects, which in turn led to the breaching. This is a critical issue. If the foundation directly caused the breaches, then causality has to be traced back to the design criteria used, and the question asked whether the design performed as expected. If the subsidence and resultant cohesional losses caused the breaches, then the chain of causality can ignore design criteria, and concentrate of the levee maintenence procedures in use prior to Katrina's landfall. Is it possible to determine, with the evidence available, which of these mechanisms was the most likely culprit?
The answer is "yes", almost certainly.
If the storm surge's initial penetration occurred at the foundation layers of the embankment, then scouring and gravity would cause most, if not all breaches to be total ones, with the crown of the levee, all the way down to the embankment's base, dissolved in the surge flow and transported away from the site of the breach. Any partial breaches would take the form of tunnels, where the embankment's base was scoured away and the crown survived intact.
If the storm surge instead penetrated the levee through compacted soil layers disturbed through differential settlement, the breaching would have taken place from the crown of the levee downward. Partial breaches would take the form of notches cut into the levee crown, with the embankment's base surviving intact.
Analysis of the aerial photographs clearly shows which mechanism was the case. Combined aggregate analysis of all of the photographic evidence shows that Katrina removed and transported 60.5 percent of the lineal length of the east reach's crown, while removing and transporting only 6.1 percent of the embankment's base. At least 90 percent of the breaching that occurred, took place from the crown downward, and did not scour away the embankment all the way to the base. There is no visible evidence of tunneling in any of the available photographic data. Additionally, even that 6.1 percent of the eastern reach which was scoured down to the embankment's base is not proven to have occurred from the base upward. All we know is that these sections are missing, not whether the scouring began at the top or bottom. In light of the complete absence of tunneling, and the 90 percent of the breaching we know began at the crown of the levee, it is a safe assumption to conclude that all breaching began at the levee crown, and that none began at the base.
In arriving at the breakdown between partial and full breaching, each image was split into two parts, analyzed seperately, and averaged together to arrive at the sum totals. The breakdown is shown in the image below.
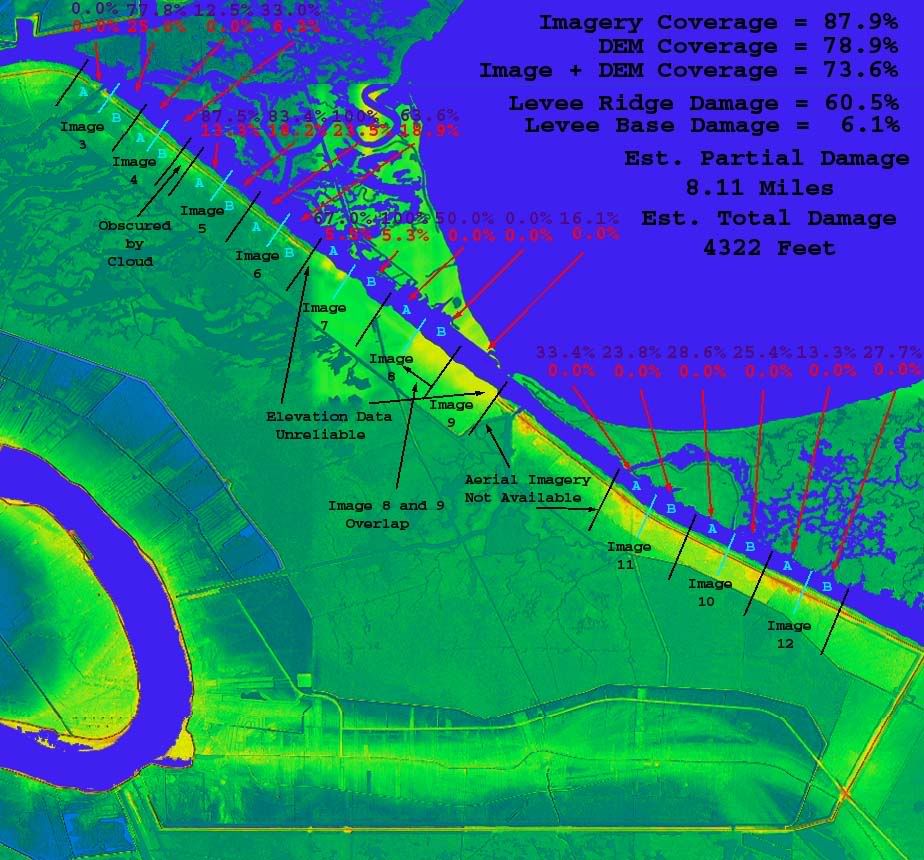
This image is rendered from a larger view of the same 3 meter per pixel DEMs used in the correlational analysis. The extent of each image is shown in black, the subsections used for closer inspection are shown in light blue, fill transport occurring at the crown only, as a percentage of total length is shown in violet, and fill transport where scouring cut all the way to the embankment's base, as a percentage of total length is shown in red.
The conclusion then is inescapable. Sections of the levee sank, after construction, a process known as subsidence, and accounted for in maintenence scheduling, disrupting compacted fill layers within the embankment, which then failed under the onslaught of Hurricane Katria's storm surge. The failures took place from the levee crown and proceeded downward, most affecting those areas which exhibited the most pre-storm subsidence, and the most affected layers were those which proportionally sank the furthest vertical distance, usually those layers nearest the embankment's crown. The primary culprit in this failure then becomes levee maintenence, not levee design criteria. Questions related to who was aware of the subsidence prior to hurricane Katrina, and what was done to mitigate this deterioration are addressed in the following section.


