...a problem with several of your numbers...
 |
 |
The Debt To the PennyCurrent Amount
08/10/2005 $7,880,078,708,086.37 Current
Month
08/09/2005 $7,883,572,311,422.86
08/08/2005 $7,882,577,243,511.10
08/05/2005 $7,880,012,385,205.52
08/04/2005 $7,878,734,742,338.35
08/03/2005 $7,869,304,285,712.51
08/02/2005 $7,877,501,670,822.86
08/01/2005 $7,869,521,621,947.05
Prior
Months
07/29/2005 $7,887,617,581,195.58 |
 |
|
|
Thanks for the heads up on my data problem. While I was trying to figure out how my data got corrupted, I got so turned around that I redid the calc's (new figures).
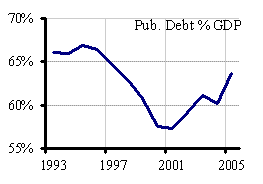
In fact, I went over my annual figures and compared the end of FY debt totals to third quarter gdp, so now my '93-05 plot shows an up tick worse than yours. So I'll agree that we can't get fired for saying to the boss that "the debt is continuing to rise through 2005".
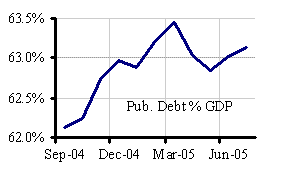
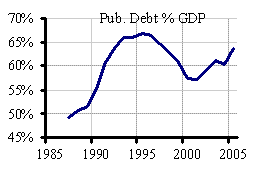
Then again, I'd go on to say that the boss might loose his job if he left it at that. Right now (8/10 compared to 8/9 or to 7/29) Public Debt is decreasing --even in current numbers. A closer look at this years up tick month by month (interpolating gdp) shows we're not at a '05 peak and (IMHO) the trend is benign. I get the same impression looking at the 20 year trend.
We're totally in agreement that "it isn't a precise measurement", and that public debt is only important in how it affects more proximate indexes of economic well-being (wealth, income, employment). I keep finding that those indexes are up now from 10 years ago, which were up from the previous decade and the one before. You said you're worried about the dept%gdp and I said I wasn't worried. Maybe we can meet half way at 'mindful'.
Thanks for the heads up on my data problem. While I was trying to figure out how my data got corrupted, I got so turned around that I redid the calc's (new figures). In fact, I went over my annual figures and compared the end of FY debt totals to third quarter gdp, so now my '93-05 plot shows an up tick worse than yours. So I'll agree that we can't get fired for saying to the boss that "the debt is continuing to rise through 2005".
I've likewise run into that problem of comparing fiscal year numbers to calendar numbers. In fact, I usually try to grab my numbers from as few sources as possible in order to minimize the chance that I unintentionally combine data that is not strictly comparable.
Then again, I'd go on to say that the boss might loose his job if he left it at that. Right now (8/10 compared to 8/9 or to 7/29) Public Debt is decreasing --even in current numbers. A closer look at this years up tick month by month (interpolating gdp) shows we're not at a '05 peak and (IMHO) the trend is benign. I get the same impression looking at the 20 year trend.
I think that a few days or weeks is too short a period to look at the debt, at least without understanding the precise manner in which the debt goes up or down over such a short period. It's likely that 8/10 compares well to 8/9 and 7/29 simply because of certain revenue payments that are credited to the balance between those dates... just as your bank balance goes up when your periodic work checks are deposited.
Regarding the graph of longer-term projections that I posted in post #314, you have to be careful in reading too much into the 20 year trend. The graph shows the debt held by the public, not the gross federal debt. That's why it shows about 40% of GDP for 2005 instead of the 63.7% of GDP that you calculated. That also means that it is not showing the increasing debt to Social Security and other trust funds that will be growing for the next decade or two. As Social Security and other trust funds start to redeem their bonds, however, these two debts will become much closer. Hence, the graph gives a better view of the gross federal debt over the longer term.
For the shorter term, it may be better to look at the projections from the 2006 Mid-Session Review, released by the Bush Administration about a month ago. Following are those numbers:
PUBLIC DEBT AS PERCENT OF GDP - PROJECTED

      Public            % of
Year    Debt     GDP     GDP
-----------------------------
2004   7,355  11,554    63.7
2005   7,942  12,271    64.7
2006   8,587  12,966    66.2
2007   9,165  13,681    67.0
2008   9,689  14,429    67.1
2009  10,204  15,198    67.1
2010  10,713  16,001    67.0

Source: Fiscal Year 2006, Mid-Session Review, Tables S-1 and S-16,
        online at this link
As can be seen, the review projects that the gross federal debt or public debt (as opposed to the debt held by the public) will stabilize at about 67% of GDP from 2007 through 2010. That is close to the prior peak in 1995. It's unclear exactly what will happen in the years immediately after 2010. In any case, the long-run projections have the debt rising sharply over the longer term.
We're totally in agreement that "it isn't a precise measurement", and that public debt is only important in how it affects more proximate indexes of economic well-being (wealth, income, employment). I keep finding that those indexes are up now from 10 years ago, which were up from the previous decade and the one before. You said you're worried about the dept%gdp and I said I wasn't worried. Maybe we can meet half way at 'mindful'.
I agree that the truth lies somewhere between the beliefs of the "Religion of Doom" and the beliefs of the "Religion of Happy-Happy-Joy-Joy". I believe that it would have been better if we could have paid down the debt a bit in preparation for the Boomer retirement (when we would likely run in back up). However, that's water under the bridge. At this point, I think we need to hold the Administration to its Mid-Session projections to cut the deficit in half and stabilize the debt and begin the work on a serious long-term solution to the budget problems that we are projected to face with the Boomer retirement.