Skip to comments.
Deficit tide ebbing (WARNING: GOOD NEWS!)
The Washington Times ^
| Thursday, July 7, 2005
| Donald Lambro
Posted on 07/07/2005 5:17:51 AM PDT by expat_panama
The good news this week is the unexpected surge in federal tax revenues that is slashing the federal budget deficit by about $100 billion. This is especially welcome news to supply-side tax-cutters who argued all along that lower tax rates spur stronger economic growth, which, in turn, creates more jobs that increases tax revenues. That is happening now. It's embarrassing news for President Bush's diehard Democratic critics, who predicted his tax cuts would worsen the budget deficits and drive the government deeper into debt. They argued throughout last year's elections that the tax cuts failed to grow the economy, create jobs or improve fiscal health.
(Excerpt) Read more at insider.washingtontimes.com ...
TOPICS: Business/Economy; Culture/Society; Government; News/Current Events; Politics/Elections
KEYWORDS: bushtaxcuts; deficit; lambro; supplyside
Navigation: use the links below to view more comments.
first previous 1-20, 21-40, 41-54 next last
To: expat_panama
An even better way to look at it is the land belongs to the people and the incumbents shouldn't be spending against it to buy re-election.
21
posted on
07/07/2005 9:01:04 AM PDT
by
Moonman62
(Federal creed: If it moves tax it. If it keeps moving regulate it. If it stops moving subsidize it)
To: Mase
tax-and-spend redistributionist policies masquerading as fiscal discipline..
Very well put. Reminds me of how the Patsies are always pushing redistributionist policies masquerading as patriotism.
To: expat_panama
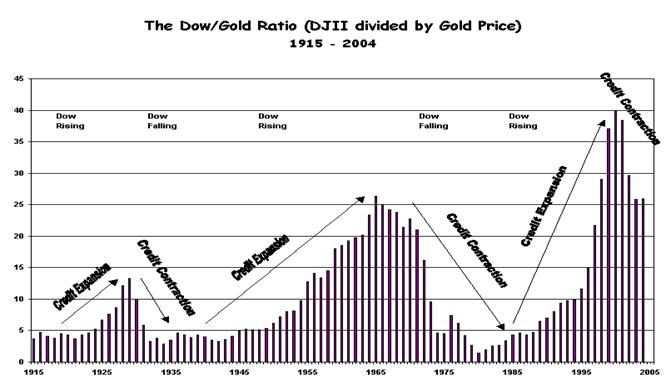
The Dow/Gold ratio says we're going into the third major downturn since 1929.
There's nothing we can do about it the die is cast.
http://www.kitco.com/weekly/paulvaneeden/jul042005.html
BUMP
23
posted on
07/07/2005 9:08:56 AM PDT
by
tm22721
To: tm22721
There's nothing we can do about it the die is cast.Haha. That's pretty funny. Do you have enough canned tuna and bottled water in that shelter?
24
posted on
07/07/2005 9:27:30 AM PDT
by
Toddsterpatriot
(If you agree with Marx, the AFL-CIO and E.P.I. please stop calling yourself a conservative!!)
To: Toddsterpatriot
http://www.tocquevillefunds.com/press/article.php?id=90
The damage is done this chart shows that the third credit cycle is over. Most including you just don't know it yet.
BUMP
25
posted on
07/07/2005 9:57:57 AM PDT
by
tm22721
To: tm22721
The damage is done this chart shows that the third credit cycle is over. Oh, the chart shows, then it must be true. Charts are never wrong when it comes to predicting the future.
Most including you just don't know it yet.
So what's going to happen? Exactly? How much time do we have before the disaster strikes? A day? A week? A month? Six months? I just want to pin you down. So when it doesn't happen I can laugh at you again. Thanks.
26
posted on
07/07/2005 10:03:24 AM PDT
by
Toddsterpatriot
(If you agree with Marx, the AFL-CIO and E.P.I. please stop calling yourself a conservative!!)
To: expat_panama
Listen to the DU heads exploding.
27
posted on
07/07/2005 11:22:13 AM PDT
by
SandRat
(Duty, Honor, Country. What else needs to be said?)
To: Toddsterpatriot; tm22721
The damage is done this chart shows that the third credit cycle is over. Most including you just don't know it yet.
So that's what you were talking about -- now let's see if I'm following you.
I hear you saying something to the effect that when we're at five or so years after a peak in the Dow/Gold Ration, then we're in a real bad way because that means it has something to do with a long term "Credit contraction".
Are you saying we're in the middle of a great depression like it was in 1934? If so, then you must have loved Kerry: "the worst economy since Hoover".
Or maybe you're saying we're back in 1970 and in four years the price of oil will double (?!). Give us all a little help here and tell us what you mean.
To: expat_panama; Lee'sGhost; Moonman62; Paleo Conservative; SandRat; musanon; Modernman; ...
The debt burden has gone down over the past decade even though revenue dropped more than spending. The reason is that the economy grew so much. You're wrong. The following table shows the items that you're looking at plus the deficit:
       DEBT, DEFICIT, RECEIPTS, AND OUTLAYS
                 (percent of GDP)

          Gross   Public    Total    Total  Unified
  Year     Debt     Debt Receipts  Outlays  Deficit
---------------------------------------------------
  1992     64.1     48.1     17.5     22.1     -4.7
  1993     66.2     49.4     17.6     21.4     -3.9
  1994     66.7     49.3     18.1     21.0     -2.9
  1995     67.2     49.2     18.5     20.7     -2.2
  1996     67.3     48.5     18.9     20.3     -1.4
  1997     65.6     46.1     19.3     19.6     -0.3
  1998     63.5     43.1     20.0     19.2      0.8
  1999     61.4     39.8     20.0     18.7      1.4
  2000     58.0     35.1     20.9     18.4      2.4
  2001     57.4     33.0     19.8     18.5      1.3
  2002     59.7     34.1     17.8     19.4     -1.5
  2003     62.4     36.1     16.4     19.9     -3.5
  2004     63.7     37.2     16.3     19.8     -3.6
  2005*    65.7     38.6     16.8     20.3     -3.5

          Gross   Public    Total    Total  Unified
AVERAGES   Debt     Debt Receipts  Outlays  Deficit
---------------------------------------------------
Clinton
 94-01     63.4     43.0     19.4     19.5     -0.1
Bush
 02-04     61.9     35.8     16.9     19.7     -2.9
 02-05*    62.8     36.5     16.8     19.9     -3.0

* projected
Source: 2006 U.S. Budget, Historical Tables 1.3 and 7.1
The averages appear to pretty much agree with the averages that you plotted. On average, the public debt was 43 percent under Clinton and 36 percent under Bush. However, the average deficit was nearly zero under Clinton and 3 percent under Bush. What gives?
A closer look at the debt shows that Clinton inherited a public debt of 49.4% of GDP and, during his term, it came down to 33% of GDP. Bush then inherited that 33% of GDP debt and it is projected to rise back up to 38.6& of GDP this year. What you have shown is that, if a President inherits a debt level that is 16.4% of GDP below that inherited by his predecessor, the debt is likely to average a lower percent of GDP even if he runs significantly larger deficits. Bush's policies have helped cause receipts to drop from 19.8% to 16.8% of GDP and outlays to rise from 18.5% to 20.3% of GDP. As a result, his tax-cut and spend policies have caused the balance to drop from a 1.3% of GDP surplus to a 3.5% of GDP deficit. This, in turn, has caused the public debt to rise from 33% to 38.6% of GDP and the gross debt to rise from 57.4% to 65.7% of GDP. No surprises there.
The flaw in your reasoning is that you are basically comparing apples and oranges. The debt is a result of the receipts and spending under all previous presidents. The only thing that is effected by a specific President's policies is NEW debt, that is deficits. How can you blame Clinton for the high level of debt that existed when he took office? Likewise, how can you credit Bush for the less debt (as a percent of GDP) that existed when he took office? The answer, of course, is that you can't. If you want to judge the effect of a President's policies, you need to look at the DEFICIT, not the DEBT.
29
posted on
07/08/2005 12:49:55 AM PDT
by
remember
To: remember
How can you blame Clinton for the high level of debt that existed when he took office? Likewise, how can you credit Bush for the less debt (as a percent of GDP) that existed when he took office? The answer, of course, is that you can't. Politics is the art of blaming everything bad on your opponent.
I was wondering if you have any explanation for long term bond yields being so low. Greenspan seems to be stumped.
30
posted on
07/08/2005 12:58:14 AM PDT
by
Moonman62
(Federal creed: If it moves tax it. If it keeps moving regulate it. If it stops moving subsidize it)
To: Moonman62
LT interest rates are low because are real negotiable debt is only a little over 4 Trillion. This is a much smaller % of our GDP than the average Euro country. So Japan, UK and carribian banks all have a ton invested in treasuries and we just dont make many of them.
31
posted on
07/08/2005 4:43:50 AM PDT
by
fooman
(Get real with Kim Jung Mentally Ill about proliferation)
To: remember
This data does not make much sense, and in any is not updated to reflect the increased revenue from dynamic scoring.
32
posted on
07/08/2005 4:45:54 AM PDT
by
fooman
(Get real with Kim Jung Mentally Ill about proliferation)
To: remember
1The debt burden has gone down ... · 29.You're wrong... the public debt was 43 percent under Clinton and 36 percent under Bush.... ... blame Clinton for the high level of debt that existed when he took office?
That's an excellent point and it needs to be borne in mind, but the real "apples and oranges" problem here is the mix of politics and economics.
Then again, we need all four to eat, so we do the best we can. IMHO the Wash Times article muddled the two a bit, but but let's focus on this concept of debt burden. I pointed out that it's lower now. You pointed out that the debt burden is increasing now while it was falling before. Let's get comfortable with the fact that we're both right-- neither of us is "wrong".
Our concept of debt burden is the amount of the debt and the size of the economy and of our wealth. The graphed averages in post 1 show how the size of the economy can make irrelevant the effect of fiscal policy. Average deficit increased while average debt decreased.
An exclusive concentration on fiscal policy says that it's impossible for the debt to decrease with a period of increasing deficits. Yet it happened. The key to understanding the situation is economic growth. That's why I was excited about the comment in the article on how "the economy is growing much faster than expected."
To: remember; expat_panama
Hey remember, expat said :The debt burden has gone down over the past decade even though revenue dropped more than spending. The reason is that the economy grew so much.
As your table shows, the debt burden has dropped over the past decade, 1995-2005, from 67.2% of GDP to 65.7% of GDP. Revenue did drop more than spending. Revenue went from 18.5% to 16.8% (drop of 9.2%) of GDP, spending went from 20.7% to 20.3%(drop of 2%) of GDP.
So, what's your disagreement with expat_panama's statement again?
34
posted on
07/08/2005 10:42:37 AM PDT
by
Toddsterpatriot
(If you agree with Marx, the AFL-CIO and E.P.I. please stop calling yourself a conservative!!)
To: Toddsterpatriot
So, what's your disagreement with expat_panama's statement again?LOL
I love Friday afternoons.
To: expat_panama
Don't you hate it when you try to refute an argument and end up proving it? Willie Green did that once arguing about foreign steel. He mostly avoids me now.
36
posted on
07/08/2005 11:13:46 AM PDT
by
Toddsterpatriot
(If you agree with Marx, the AFL-CIO and E.P.I. please stop calling yourself a conservative!!)
To: expat_panama
37
posted on
07/08/2005 11:23:19 AM PDT
by
MattinNJ
(Allen/Pawlenty in 08-play the map.)
To: Toddsterpatriot
He avoids
you too? --and all this time I thought I had BO or something.
I guess over time there'll be fewer and fewer people that he'll be willing to talk to. Just as well I guess.
To: expat_panama
I guess over time there'll be fewer and fewer people that he'll be willing to talk to. He won't talk to people who can refute his fluff.
39
posted on
07/08/2005 12:01:49 PM PDT
by
Toddsterpatriot
(If you agree with Marx, the AFL-CIO and E.P.I. please stop calling yourself a conservative!!)
To: Moonman62
Politics is the art of blaming everything bad on your opponent. I was wondering if you have any explanation for long term bond yields being so low. Greenspan seems to be stumped.
No, I have no explanation. I have read some theories on the matter such as in the comments by Bill Gross at http://money.cnn.com/2005/05/18/markets/bondcenter/gross_outlook/. I do think that in order to come up with an explanation, it would help to have a better understanding of those who buy long term bonds. I don't own any long bonds, having heard for years about the risks of holding them, especially when interest rates are expected to rise. Nor do I know anyone who owns them. Hence, the precise motivations of long bond traders are a bit of a mystery to me.
40
posted on
07/09/2005 2:19:04 AM PDT
by
remember
Navigation: use the links below to view more comments.
first previous 1-20, 21-40, 41-54 next last
Disclaimer:
Opinions posted on Free Republic are those of the individual
posters and do not necessarily represent the opinion of Free Republic or its
management. All materials posted herein are protected by copyright law and the
exemption for fair use of copyrighted works.
FreeRepublic.com is powered by software copyright 2000-2008 John Robinson