Posted on 02/02/2004 11:54:07 AM PST by Truth666
January incredible Atlantic records continue.
The citation is Smithsonian Physical Tables, First Reprint of Eighth Revised Edition, volume 88, printed 1934, Table 704, Atmospheric Ozone, dated 1926 and 1929, by Dr. Gordon Dobson. The table and accompanying text shows large variations by season and latitude. The farther north (or south), the greater the seasonal variation. Doctor Dobson specifically states in the table text that "large variations occur(up to 0.1 cm)" that he ascribed to seasonal "meteorological conditions".
I don't know what units "cm" are; obviously it's not centimeters. Because of Dobson's expertise, modern ozone measurements are in Dobson units. How does "cm" compare to Dobson units?
Since CFC's were not introduced to the public until 1930, Dr. Dobson's 1929 observations of a large seasonal variation in atmospheric ozone, that occurs in the extreme latitudes, predates that introduction.
That would be true; and it is also true that the stratospheric ice clouds that form in the Antarctic polar vortex are the catalytic surfaces that enable ozone destruction by CFCs. However, it is hard to reconcile what Dobson wrote with the Halley Bay data that doesn't show seasonal ozone depletion over Antarctica prior to about 1965. There aren't any descriptions of processes that decrease ozone dramatically just due to ice particles.
Compare the magnitude of the effect Dr. Dobson observed in 1929 to the graph you posted in #78 and you'll see that Dopson's 0.1 cm change is a far greater change than what your source described as "a dramatic loss of ozone".
Not knowing how to compare the two units, that is currently impossible. The graph posted shows an approximate decline in October ozone concentrations by a factor of 3 in the "hole". It boggles my mind that Dobson saw larger ozone variability than that.
If one can measure a natural seasonal and latitudinal variation in atmospheric ozone, why then should we be surprised that there might also be a natural periodic (over decades and centuries) variation in that same ozone?
I wouldn't be surprised if such periodicity could be shown, but there isn't any data to indicate that it has happened. On the contrary, the chemical reactions that cause the depletion of ozone in the Antarctic polar vortex, and the environment in which these reactions occur, have been described and confirmed by scientists, as shown on the Web site I provided.
This is additional information on Dobson:
"The first regular measurements of ozone began in the 1920s. Sir Gordon Dobson, who devised the ozone spectrophotometer that now bears his name, started making ozone measurements at Oxford University in England. His Dobson spectrophotometer measures the total amount of ozone from the ground to the top of the atmosphere per unit area. The resulting ozone value is referred to as a "column amount." It does this by measuring the amount of solar ultraviolet radiation absorbed by the atmosphere.
One of the first things that Dobson discovered was the variability of the amount of column ozone. He observed that it varies in a reasonably regular manner with the changing of seasons. He also observed that significant day-to-day variability are superimposed on seasonal variations. He noted that this day-to-day variability correlated with the passage of weather systems over his measurement site.
To investigate the variation of the total column ozone amount with weather systems, Dobson had several more instruments built which he distributed throughout Europe. These could then make simultaneous measurements at a number of points on a daily basis. The results showed a regular variation of the total column amount of ozone with weather systems. When a high pressure system was over the south of England, he observed low amounts of ozone. When a low pressure system moved in, he observed that the ozone amount increased. That is, Dobson noted that ozone amount is anticorrelated (i.e., moves in opposite direction) to air pressure, rising when air pressure falls, and falling when air pressure rises.
We now know considerably more about the causes of variations in stratospheric ozone. The concentration of ozone at a location is governed by a balance among ozone production, ozone loss, and ozone transport. These processes interact to determine the amount of ozone in the stratosphere and its distribution with latitude, longitude, and altitude. They contribute to the variability of ozone observed on different time scales."
"The results of the 1925 ozone measurements were of such interest that Dobson decided to make measurements at a number of locations in Europe to study the relation between ozone distribution and synoptic meteorological variables. The winter of 1925-26 was spent building five spectrographs and calibrating them at Boars Hill. Measurements were begun in mid-1926 and by the end of 1927 ozone values had been calculated from over 5000 spectra. From these the distribution of ozone relative to pressure systems and a limited indication obtained of the variation of mean ozone with latitude was obtained.
More extensive measurements of the variation with latitude were made during 1928 and 1929 by redistributing the instruments to places widely scattered over the world. Only the instruments at Oxford and Arosa in Switzerland remained at their old stations; the others were sent to Table Mountain in California, Helwan, Egypt, Kodal Kanal, India and Christchurch, New Zealand. As before, the photographic plates were returned to Oxford for development and measurement. By the end of 1929, therefore, the main feature of the variation of the ozone amount with synoptic conditions, with latitude and with season had been established."
So there is no doubt that Dobson observed seasonal and latitudinal ozone variability. However, given that the extremely low ozone values observed at Halley Bay were at first questioned (and the TOMS satellite instrument had to be recalibrated), I find it doubtful that Dobson observed larger variability than exists in the ozone hole today.
Clarification on the points raised above would be welcome.
--Boot Hill
cogitator: "...it is also true that the stratospheric ice clouds that form in the Antarctic polar vortex are the catalytic surfaces that enable ozone destruction by CFCs."
To my knowledge, it has never been shown that CFC's themselves destroy ozone, rather it is the chlorine atoms, that allegedly originated from CFC's, that have been shown to be one mechanism of O3 breakdown. The problem with ascribing this breakdown to CFC's is that natural sources of chlorine outweigh those from CFC's by many orders of magnitude.
I knew and spoke often with the manager of the U-2 environmental recon program run by NASA out of Moffett NAS here in Silicon Valley. His squadron was the one that did the high altitude sampling out of Norway over the north pole. When he returned from that mission, I asked him if they sampled CFC's in the upper stratosphere. He said yes, they had. I asked him again, are you sure you mean CFC's or do you mean chlorine that you attributed to CFC's. He corrected himself and said that it was actually only the chlorine they were detecting, but that he was sure that it had to have come from CFC's!
cogitator: "However, it is hard to reconcile what Dobson wrote with the Halley Bay data that doesn't show seasonal ozone depletion over Antarctica prior to about 1965."
First, the Halley data doesn't extend back far enough in time to state that there was no ozone thinning prior to 1965. Second, one of the greatest mistakes of scientific experimentation, is to ignore data that doesn't fit with expected results. That Dobson's data is at variance with the Halley Bay data, merely underscores the depth of our own ignorance of the part ozone plays in atmospheric chemistry. To me, the difference in the data sets simply implies that a natural variation in polar ozone levels exists and requires further study to find out how much a variation, what is its period and what causes the periodicity.
The discovery of periodic ozone depletion is not unlike Galileo's discovery of sun spots. Prior to that discovery, the sun was believed to be perfect and unblemished product of God's handiwork. Can you imagine the panic when these blemishes were discovered. And even worse, the finding that year by year, the number, size and frequency of those sun spots continued to increase? OMG, the sun's going to be entirely covered with them if this keeps up!
That is precisely where we are today with the discovery and controversy surrounding the periodic changes in ozone levels. The problem though, has been compounded and the science essentially stopped in its tracks, by this nonsense that the thinning is caused by CFC's.
cogitator: "The graph posted shows an approximate decline in October ozone concentrations by a factor of 3 in the 'hole'." It boggles my mind that Dobson saw larger ozone variability than that."
The quote from your post #78 referred to "a dramatic loss of ozone" that occurred just during the 1970's and that decline was far less than the "factor of 3" you mention. Not only was the 1970's decline, that was described as being a "dramatic loss", only a 75 DU decline, but it was even less than the 0.1cm (100 DU) variability that Dobson observed in the 1920's. So by that standard, the variability observed by Dobson was not only "large", but indeed, it was "a dramatic loss" of ozone way back in 1929!
cogitator: "I wouldn't be surprised if such periodicity could be shown, but there isn't any data to indicate that it has happened."
The only way that you can assert that there isn't any data to support a natural variability, is to ignore Dobson's data from the 1920's. Absent any concrete evidence that his data was flawed, it is dangerous and highly speculative to ignore it simply because it doesn't support someone's expectations.
cogitator: "I find it doubtful that Dobson observed larger variability than exists in the ozone hole today."
Nor is it necessary to assert that it was larger then. It is sufficient for the moment to simply state that the scientific record (Dobson) contains reliable and unrefuted data that shows a large natural seasonal variation (0.1 cm or 100 DU) in atmospheric ozone does occur and that it was first detected prior to the introduction of CFC's.
As a parting note, have you noticed in the TOMS photos, that while there is a seasonal thinning over the South pole, there is a commensurate increase in ozone levels in areas immediately adjacent to the Antarctic? (examples here) In other words we may be witnessing an ozone transport event, rather than a genuine thinning.
Please forgive the length.
--Boot Hill
You are both correct and incorrect. Natural sources of chlorine are much larger, but those sources do not contribute Cl to the stratosphere. Because CFCs do not break down easily, they reach the stratosphere (and NASA instruments on the UARS satellite measure CFC concentrations directly -- I can provide a graphic image if you want one), where they are subject to energetic reactions due to high-energy solar radiation (the same thing that makes ozone, ironically). That breaks them down into various chlorine compounds (which were also measured by UARS instruments), which then participate in the ozone-destroying reaction pathway.
If you would read the Web site that I provided, you would learn all of this.
First, the Halley data doesn't extend back far enough in time to state that there was no ozone thinning prior to 1965. Second, one of the greatest mistakes of scientific experimentation, is to ignore data that doesn't fit with expected results. That Dobson's data is at variance with the Halley Bay data, merely underscores the depth of our own ignorance of the part ozone plays in atmospheric chemistry. To me, the difference in the data sets simply implies that a natural variation in polar ozone levels exists and requires further study to find out how much a variation, what is its period and what causes the periodicity.
The Halley Bay data goes back before 1965. Dobson's data definitely shows seasonal variability, and there are obvious reasons for that, but it doesn't show the level of ozone depletion that was observed in the Antarctic over Halley Bay. The decline began in the 1970s, and is now much larger than 100 DU (0.1 cm, according to you).
Nor is it necessary to assert that it was larger then. It is sufficient for the moment to simply state that the scientific record (Dobson) contains reliable and unrefuted data that shows a large natural seasonal variation (0.1 cm or 100 DU) in atmospheric ozone does occur and that it was first detected prior to the introduction of CFC's.
Nonsense! There is seasonal variability. It's called the Brewer-Dobson circulation pattern (and to your credit, I had to brush up on something that I learned ten years ago and forgot).
Here's what you need to do. Read the Web site provided below. Take your time. Take a week, or at least a weekend. Become acquainted with all that is now known about ozone in the atmosphere (you may be surprised). Then please reply to me and tell me if your knowledge has changed. If it hasn't, then there is nothing I can do in a piecemeal fashion that would be better than the comprehensive treatment below. (Note that the Web site includes the measurements of stratospheric CFC concentrations which I referred to earlier.)
Stratospheric Ozone: An Electronic Textbook
Finally, you wrote: As a parting note, have you noticed in the TOMS photos, that while there is a seasonal thinning over the South pole, there is a commensurate increase in ozone levels in areas immediately adjacent to the Antarctic?
It's a consequence of the air mass isolation in the polar vortex. Because ozone that is being produced in the lower latitudes cannot mix into the vortex area, it builds up (the atmospheric circulation pattern gets "dammed up" against the polar vortex wall. One of the reasons that the ozone hole disappears so rapidly when the vortex circulation breaks up is that this higher concentration of ozone mixes in quickly.
LOL, you just made the same error that my U-2 pilot friend made when he confused CFC measurements with chlorine measurements! The UARS satellite made NO direct (or even indirect) measurements of CFCs, in the stratosphere or anywhere else! You didn't specify which package aboard UARS (you claim) made that measurement, but the only one that comes close is the MLS package (Microwave Limb Sounder) which detects 17 different gases, none of which were CFCs. It did, however, measure the presence of chlorine monoxide which they inferred was a breakdown product of CFCs!
cogitator: "If you would read the Web site that I provided, you would learn all of this." And then just a few lines later: "...larger than 100 DU (0.1 cm, according to you)"
Actually, maybe you should read your own sources a bit more carefully before admonishing other to. Here is what your own sources say about the relationship between Dobson Units and centimeters: "1 Dobson Unit (DU) is defined to be 0.01 mm thickness at STP." Moreover, since I was directly quoting Dobson, it was mandatory that I quote the same units of measure he used in his original work.
cogitator: "The Halley Bay data goes back before 1965."
Yeah, it goes all the way back to 1957! You stated "the Halley Bay data that doesn't show seasonal ozone depletion over Antarctica prior to about 1965". First "prior to 1965" covers an awful lot of time, and now we find out that "prior to 1965" only goes back to 1957. Second, you are in error that the earlier Halley Bay data doesn't show seasonal ozone depletion. Here is there own data from 1957...

cogitator: "Nonsense!"
So definitive a response! It's a shame that you never made the effort to point out exactly what was "nonsense" about that sentence!
cogitator: "Here's what you need to do. Read the Web site provided below. Take your time. Take a week, or at least a weekend. Become acquainted with all that is now known about ozone in the atmosphere (you may be surprised). Then please reply to me and tell me if your knowledge has changed."
LOL, stop it, you're killing me (and you're pinging my arrogance meter)! Maybe if you'd shown some special expertise on the matter or fewer gaps in your knowledge or fewer statements in error, I might be impressed!
--Boot Hill
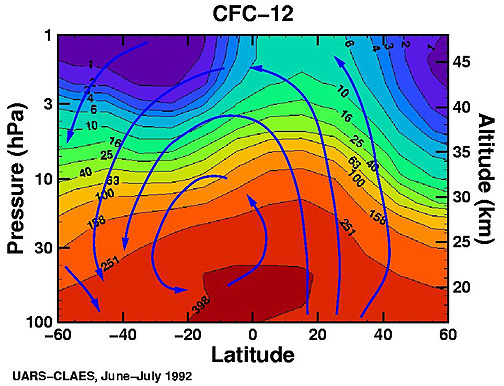
It came from the The Cryogenic Limb Array Etalon Spectrometer, a UARS instrument.
This figure is found in Chapter 12 of the electronic textbook.
Actually, maybe you should read your own sources a bit more carefully before admonishing other to. Here is what your own sources say about the relationship between Dobson Units and centimeters: "1 Dobson Unit (DU) is defined to be 0.01 mm thickness at STP." Moreover, since I was directly quoting Dobson, it was mandatory that I quote the same units of measure he used in his original work.
Fine. I was familiar with Dobson units as an expression of ozone concentration, but not the definition. Thank you for clarifying it for me. Perhaps we both would benefit from less hubris and more information.
Yeah, it goes all the way back to 1957! You stated "the Halley Bay data that doesn't show seasonal ozone depletion over Antarctica prior to about 1965". First "prior to 1965" covers an awful lot of time, and now we find out that "prior to 1965" only goes back to 1957. Second, you are in error that the earlier Halley Bay data doesn't show seasonal ozone depletion. Here is there own data from 1957...
That's an excellent graph showing a comparison between what was happening then compared to now. When I said that the Halley Bay data doesn't show seasonal ozone depletion, that meant that the mean October values were essentially constant. Sorry if that was not clear; typing these messages sometimes results in truncation of content. If you compare the data from the graph posted earlier to this one, you'll see where the 1957 data plots in October.
Yes, there is no Halley Bay data before 1957. I operate on what is known, not what is unknown or what is unmeasured. I don't think that there were any ozone measurements over Antarctica before 1957. But there were others:
"The longest record of total column ozone is from ground based Dobson measurements at Arosa, Switzerland. Figure 9.01a shows the time series of total ozone amounts at Arosa from the beginning of the record in 1926 through 1997 (Staehelin et al., 1998). The ozone measurements at Arosa show a strong seasonal cycle, with a range of about 100 Dobson Units (DU; see Chapter 1, Section 4.1 for the definition of a Dobson Unit). The dashed lines on the plot show the estimated trend of this data set for two time periods: 1926-1973 and 1973-1993. While a decrease in the latter period is perceptible, it is small relative to the seasonal cycle in the data.
However, if we smooth the data to remove the seasonal cycle, the trend in the data after 1973 is more prominent. Figure 9.01b shows the same data, but in this figure a 1-year moving average was applied to the data. That is, each point on the graph is the average of one year of data centered about that point. This is done to smooth variations on seasonal and shorter time scales in the data. The solid blue line shows the smoothed Dobson total ozone time series, and the green line shows total ozone data measured by the Nimbus 7 and Meteor 3 TOMS instruments over Arosa.
One of the first things we note in this plot is that the TOMS measurements are typically 5-10 DU larger than the Dobson measurements. It is not unusual for different types of instruments to have small offsets in the measurements they make, as all remote sensing techniques have some uncertainty associated with them. However, in this case the offset does not concern us, because it is much smaller than the size of the feature we are studying.
After it was smoothed to remove seasonal variations, the data record showed the total ozone amount over Arosa varied between 20 and 40 DU as a result of variations on time scales longer than the seasonal cycle. From the beginning of the record until the early 1970s, the data show interannual (year to year) variations, but little long-term change, or trend. However, after about 1973, the ozone amounts started to decline (dotted line). The TOMS ozone measurements show similar declines over the latter period.
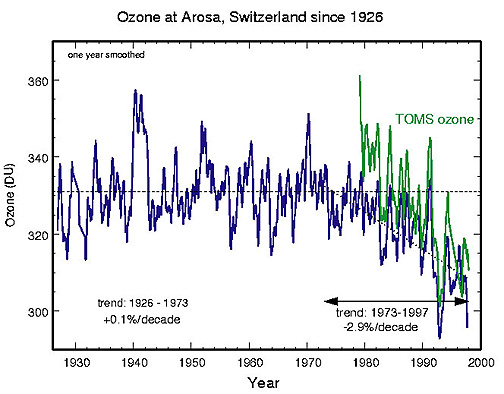
from the electronic textbook, Chapter 9.
LOL, stop it, you're killing me (and you're pinging my arrogance meter)! Maybe if you'd shown some special expertise on the matter or fewer gaps in your knowledge or fewer statements in error, I might be impressed!
You have provided some new information, and reminded me of some forgotten knowledge, and for that I thank you. However, you would still benefit greatly from reading the source that I recommended. I'm not an expert in atmospheric chemistry, but I am familiar enough with the scientific basics of the issue to know what's going on.
Three-page Article from Fortune Magazine, 9Feb04 Issue...
'CLIMATE COLLAPSE - The Pentagon's Weather Nightmare - The Climate could Change Radically, and Fast. That would be the Mother of all National Security issues.'
By David Stipp
Excerpts:...
'Global warming may be bad news for future generations...In fact, the prospect has become so real that the Pentagon's strategic planners are grappling with it.
The threat that has riveted their attention is this: Global warming, rather than causing gradual, centuries-spanning change, may be pushing the climate to a tipping point. Growing evidence suggests the ocean-atmosphere system that controls the world's climate can lurch from one state to another in less than a decade
Over the past decade, data have accumulated suggesting that the plausibility of abrupt climate change is higher than most of the scientific community, and perhaps all of the political community, are prepared to accept...after studying temperature indicators embedded in ancient layers of Arctic ice,...the data show that a number of dramatic shifts in average temperature took place in the past with shocking speed—in some cases, just a few years...'
Other related scientific-based Links
- Woods Hole Oceanographic Institute - 'Abrupt Climate Change' - Current Links
- 'THE NEXT ICE AGE' - Web Site & book by Robert Felix
- 'Celestial Mechanics - Solving the Puzzle of The Ice Ages' - Environmental Geology Slides by Prof. Ray Joesten, U of Conn
"By September 1987, progress in negotiations offered the prospect of consensus on control measures. On September 16, 1987, the Montreal Protocol on Substances that Deplete the Ozone Layer was signed by 24 countries."
"On January 1, 1989, the Protocol came into effect. Parties agreed to freeze their production and consumption of CFCs and halons within seven months of the Protocol’s entry into force, and to reduce consumption of CFC by 50% within 10 years. Developing countries were accorded a period of grace of 10 years."
10-15 years; most sites say that the decline in ozone levels and the first indications of the hole over Antarctica occurred during the mid-1970s. I don't know when CFC production and usage began in earnest; late 1950s?
Disclaimer: Opinions posted on Free Republic are those of the individual posters and do not necessarily represent the opinion of Free Republic or its management. All materials posted herein are protected by copyright law and the exemption for fair use of copyrighted works.