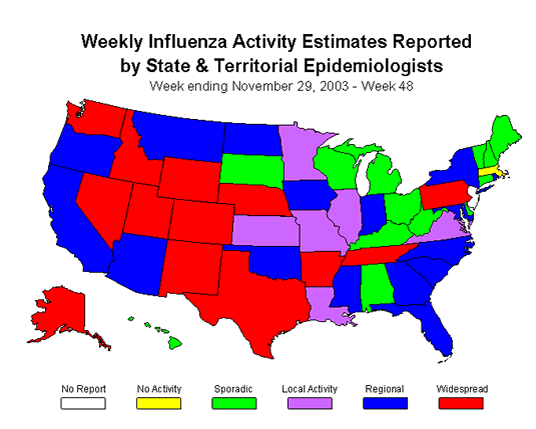
"It would be helpful to know how many children have died of the flu in past years. Then useful comparisons can be made."
Well, you can't track mortality by age with this resource, but this is what I use for info:
http://www.cdc.gov/flu/weekly/ Note in the chart here:
http://www.cdc.gov/flu/weekly/weeklyarchives2003-2004/images/bigpi48.gif as of Week 40 we were BELOW the seasonal baseline.
http://www.cdc.gov/flu/weekly/weeklyarchives2003-2004/images/picILI48.gif This chart shows that the situation changed- lots and lots of visits to E-rooms for flu-like symptoms. The chart shows the past two seasons, too. The increase in ER visits could be because of an unusually severe strain, or newscasters urging people to get medical help fast once symptoms show up. Unfortunately we won't be able to separate the two effects until we have more detailed mortality stats- because visits to E-rooms are voluntary and reporting is not required, but people dying is a required report and not usually voluntary.
Could someone who knows HTML better than me post the graphs in the thread?


